U.S. Bank Credit Continues Declining, Increasing Global Fragility
2023.07.12 03:31
While many media pundits focus on the conflicting jobs data and equity markets, there’s something else sending out warning signs.
Something that’s been grossly ignored.
I’m talking about bank credit (lending) trends.
Many may know that I’ve written about banking mechanics before – explaining how banks create money (not the Federal Reserve) through loan creation.
But to give you some brief context: banks create money by making loans (an asset) because they must also create an equivalent deposit (liability). And the more loan creation, the more stimulative it is. And vice versa.
This is how modern banking works.
The problem today?
Well, there are a few. But the big one is that bank credit (lending) has completely collapsed.
 Bank Credit, All Commercial Banks
As you can see, bank credit historically sinks before – and during – a recession as demand for loans declines and banks grow uncertain, curbing new loans.
Total bank credit in year-over-year terms as of June 30th, 2023, is an anemic 0.5%. And will most likely sink into negative territory in the coming months. And the only other time this happened in the last 50 years was during 2009-10.
This has serious repercussions for economic growth and debt markets since the U.S. depends on credit for consumption.
A big reason is that real hourly wages in the U.S. have barely grown at all since 1979 (an anemic 8%).
 Median Usual Weekly Real Earnings
Thus if real wages can’t justify consumption (especially housing and vehicles), credit is necessary to subsidize that gap.
For instance, the home price to median household income ratio in the U.S. is at a record high of 7.55 (compared to the previous record high in 2008 at 6.80).
This means that home prices are more than 7.55x greater than median household incomes (counted as two people or more bringing in money).
Thus since wages alone can’t justify any home buying, more and easier credit standards were necessary to keep the economic machine going.
The point here is that the economy requires ever more credit or government handouts to keep consumption – and thus the economy – going (although we can’t escape the laws of diminishing debt returns).
But after yesterday’s data, U.S. consumer borrowing is showing signs of cooling.
To put this into perspective, total credit rose just $7.2 billion – which was the smallest advance since November 2020. And missed expectations by $13 billion.
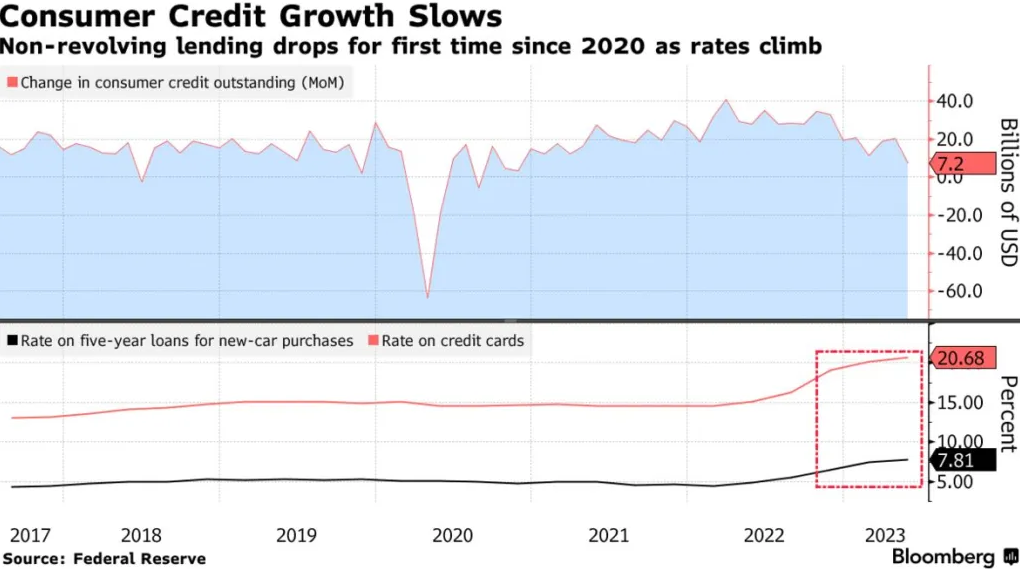
Meanwhile, non-revolving credit – such as loans for school tuition and vehicle purchases – decreased by $1.3 billion, Marking the first decline since April 2020.
Less credit essentially means less excess consumption and liquidity. Since wages alone must carry purchases and debt servicing.
This is why credit flows are so important – especially at the margins.
Now, I’ve seen many argue that total bank credit is still high (roughly $17.33 trillion). And it no doubt is.
But remember: when it comes to banking data and leading economic indicators, it’s not the ‘stock’ (balance) that matters, but the ‘flow’ (rate of change) that does.
For example, a ‘stock’ would be how much money you have in your bank account. And the ‘flow’ is how much money is coming in and out. Both matter, but the flow is important to gauge the trend of the future stock.
And flows in credit are deteriorating fast and sharp.
Just take a look at the U.S. credit impulse index (aka the % of new loans created by the private sector relative to ).
As of Q1-2023, the credit impulse is negative 7.5% – indicating much less aggregate loan creation.
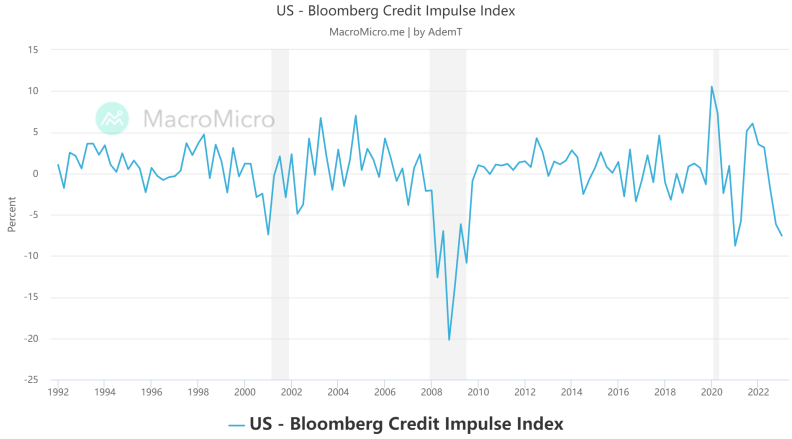 US Bloomberg Credit Impulse Index
Keep in mind that credit impulse is used to measure the “rate of change of change” of global credit creation. The higher is more stimulative, and the lower is a drag.And – historically – the 6-month credit impulse has by far the best track record in terms of being a leading indicator of GDP growth.
But this isn’t just a U.S. issue – it’s a global one as I’ve written about recently.
According to @MacroAlf, the G5 (France, Japan, the United Kingdom, the United States, and Germany) credit impulse has plunged negative.
And if history means anything, it will send U.S. corporate earnings lower (with a 15-month lag).
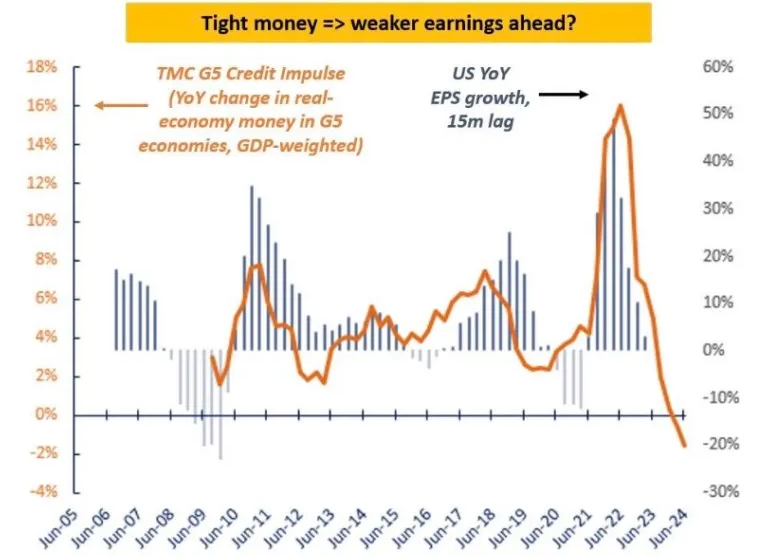
I can’t stress enough how important credit is to the global economy and the ripple effects it has – from corporate earnings and investment to asset prices and consumer spending.
- Or – putting it simply – when credit flows increase, there’s a boom. And when credit flows contract, there’s a bust.
Meanwhile, dollar-denominated credit abroad (aka bank loans in dollars in foreign markets) has sunk negative in year-over-year terms.
This is only the third time this has happened in the last 20 years (the last two being 2008 and 2020). . .
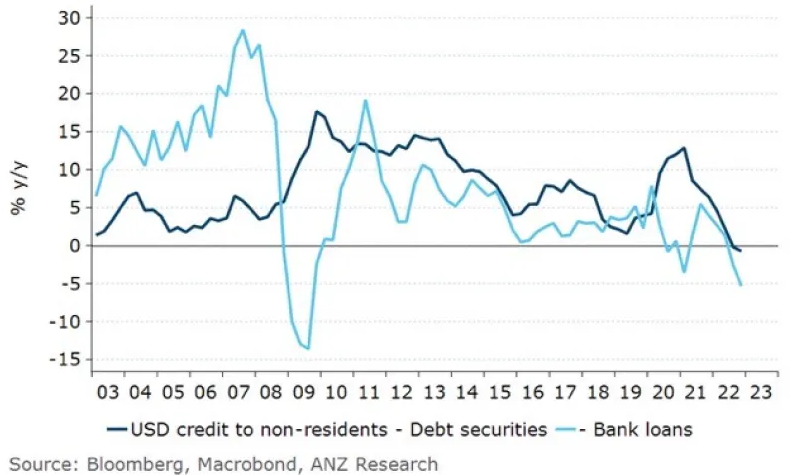
Thus the global dollar shortage will most likely worsen, increasing instability abroad as dollar debts that must be rolled over struggle to find new dollar loans.
Now, you may be wondering, “Ok, so credit’s clearly declining. What does that mean?”
There are many issues with it – but I believe these are the two biggest issues ahead.
1. Declining credit increases bank instability and crushes their net interest margins (NIMs) – which has already happened.
For instance – according to Bloomberg – banks spent more on net interest owed than what they made in average quarterly profits.
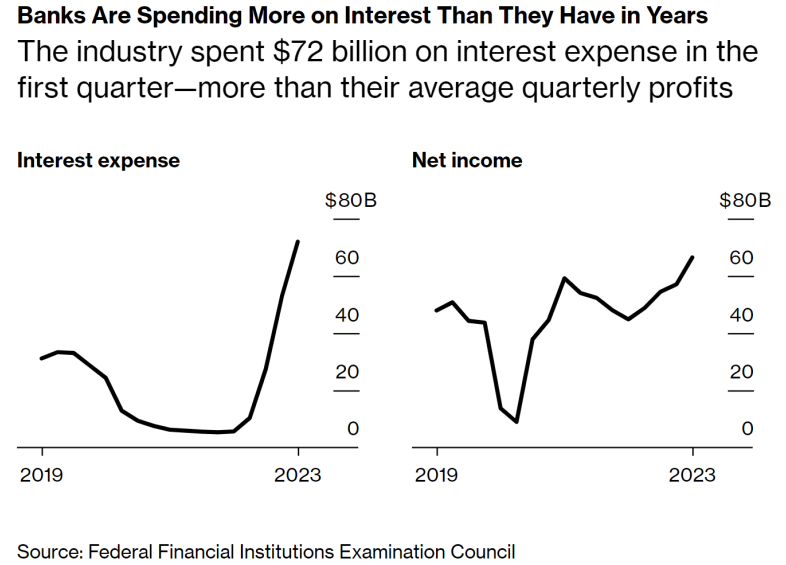
And this data is from right before the wave of bank failures (which has only made their NIMs weaker as they depended on borrowing costly reserves from the Fed and Federal Home Loan Banks).
Banks must make loans to create assets for themselves. But as they’re lending less, this creates an issue for their bottom lines.
And more often than not, bank issues are the spark that lights an economic crisis. . .
2. Declining credit (falling new loans) combined with higher debt repayments (debtors making payments) is ‘money destruction’ – which is deflationary as the U.S. money supply contracts.
Remember: making new loans creates new deposits (money). But greater debt repayments do the exact opposite (extinguishing the deposit and loan).
We’ve already seen the U.S. money supply flow plunge – with M2 (currency, checkings, savings, and money market accounts) sinking negative 4% as of May.

Keep in mind this is the first time that the M2 rate of change has ever fallen negative (at least as far back as 1960 since the data collection began).
This is very deflationary as the money supply is shrinking.
The problem?
Nominal debt balances aren’t shrinking. And if deflation takes hold, asset prices will potentially sink relative to debt burdens. Thus making the debt servicing costs increase in ‘real’ terms. Forcing liquidations (aka an asset ‘fire sale’ in a rush for cash).
Making matters worse, there’s a tidal wave of commercial real estate and corporate debt maturing in the next couple of years.
They’ll be forced to refinance at a time when the money supply is shrinking, and banks are cautious to lend. Further amplifying fragility.
So – in summary – don’t discount credit flows and the impact it has on markets and economies.
I was writing about banking fragility mounting last year as the inverted curve caused bank assets to plunge (they’re still sitting on over $500 billion in unrealized losses), and loan creation was beginning to fade.
And these key fundamental issues have only grown worse since then.
The Motley Fool noted recently:
“During the three previous instances [1975, 2002, 2008-2010) where commercial bank credit broke from its seemingly endless uptrend and fell by at least 1.5%. The S&P 500 lost in the neighborhood of 50% of its value.”
Well, since the March peak in bank credit, it’s now down 1.5% (and was down 1.61% at the end of May).
Now, I doubt that the will fall 50%.
But hey, anything can happen, right?
At the very least – it’s not a good sign for equity momentum or the economy.
Just some food for thought.


