The Bond Market’s Ongoing Battle With the Federal Reserve
2024.08.27 03:51
Since the federal funds rate hit 5% in March 2023, the bond market has been battling it out with the central bank. The market assumed that the U.S. economy was heading for recession and required more accommodative monetary conditions.
This negative outlook has been influenced by the pervasive loose monetary policy that was put in place in 2009, with investors believing that the economy needs lower interest rates in order to function. However, not only have investors forgotten what “normal” bond market conditions are like, they have also forgotten the adage “Don’t fight the Fed!”
Since the economy emerged from the pandemic, the Fed’s focus on data dependency has been sensible given that traditional central bank models appear to have been less helpful in managing monetary policy.
But despite the fact that central bankers and market participants are looking at the same data, the bond market has persistently expected interest rates to fall further and faster than has actually happened.
The main reason for this persistent error, it seems, is that the market has only been looking at the cost of capital and not the return on capital. Hence, it is unclear why the bond market’s ongoing negativity over interest rates is right this time either.
One critical data point that the bond market would do well to heed, particularly given its recent poor record in predicting the path of interest rates, is the diverging view within the Fed concerning the level of interest rates in the longer run.
For the last five years, the median dot plot for long-run interest rates has been 2.5%. But in June 2024, this increased to 2.75% with an emerging cluster of views between 3.5%-3.75% as indicated in Exhibit 1.
Exhibit 1: Fed Dot Plot Projections
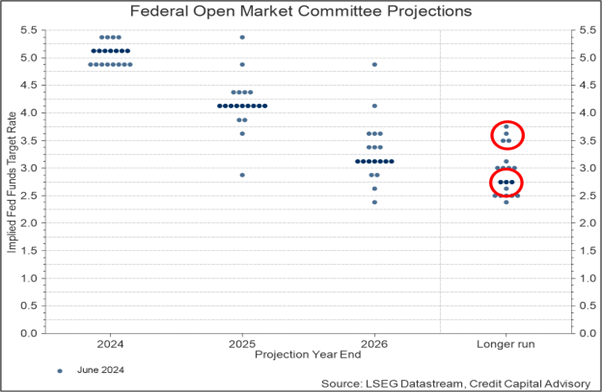
This longer-run level of rates is close to where Credit Capital Advisory (CCA) has forecasted U.S. interest rates based on a credit disequilibrium model as set out in Profiting from Monetary Policy.
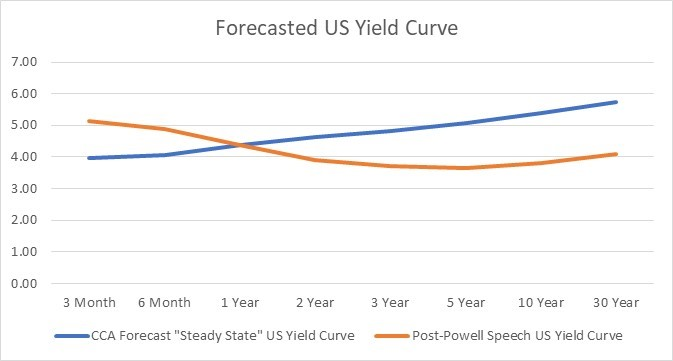
If a data dependency approach ultimately supports the disequilibrium credit cycle model, this will have implications for movements across the yield curve. While the short end of the curve still has some way to fall, the rest of the curve extending out from two years will need to rise considerably as demonstrated in Exhibit 2.
Exhibit 2: CCA U.S. Yield Curve Forecast
Source: LSEG Datastream, Credit Capital Advisory
If the outlook for five-year yields, which is the median maturity for corporate borrowing, rises as much as 100 basis points, investors need to understand how this will affect the profitability of firms and therefore capital values.
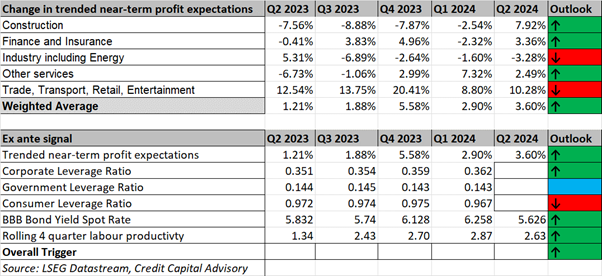
The latest CCA U.S. quarterly credit cycle signal as set out in Exhibit 3 highlights that the aggregated return on capital is expected to increase, with business and financial services indicating a robust outlook.
The recent labor productivity data also supports the expected rising return on capital across the broader economy. There are weaker areas though: Industry including Energy has a negative outlook and crucially expected profits across Trade, Transport, Retail, Entertainment are now decelerating.
This indicates that the credit cycle has shifted into a late-cycle paradigm coupled with a declining consumer leverage ratio.
Exhibit 3: U.S. Wicksellian Differential ex-ante Signal
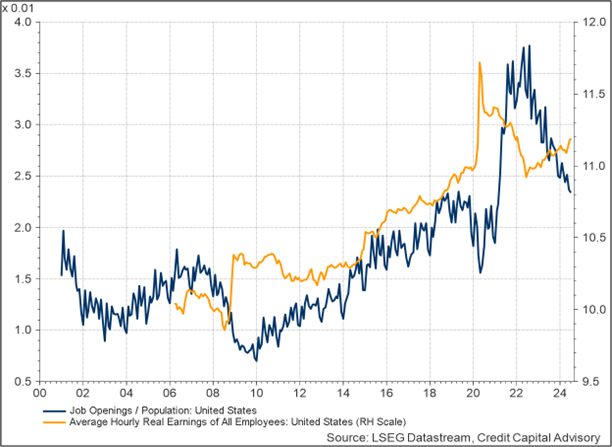
Despite the outlook for the consumer appearing less robust, the labor market still looks reasonably solid. Real wages are continuing to rise, and while job openings/population have fallen considerably, they remain at the top end of historic levels as noted in Exhibit 4.
Exhibit 4: U.S. Labor Market Indicators
Although the outlook for profits in certain sectors is up, the evidence suggests the cost of capital is likely to rise once the bond market realizes its mistake. Indeed, the data is pretty clear that as a central bank reduces interest rates, not only do short-term rates fall but long-term rates tend to rise due to the term premium.
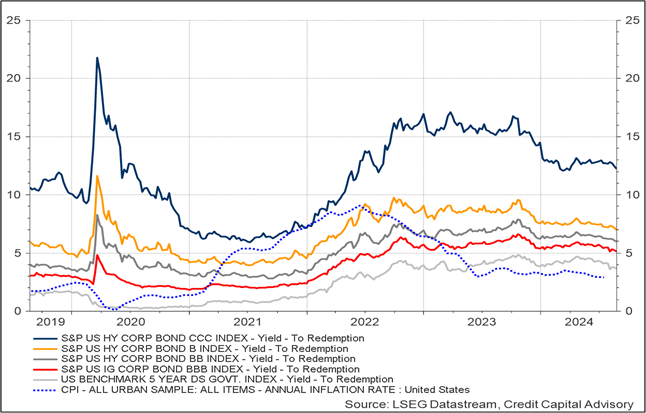
This upward shift in the five-year benchmark is also likely to widen credit spreads. Indeed, given that the U.S. economy has now moved into a late phase of the credit cycle, single B bonds look overpriced as per Exhibit 5. Any wider move on B bond spreads will place some additional pressure on credit spreads for BBB bonds.
Exhibit 5: U.S. Bond Market Indicators
Given the late cycle position of the U.S., asset allocators therefore may wish to look elsewhere for returns. As was noted last quarter, the U.K. is finally indicating a positive outlook for capital values.
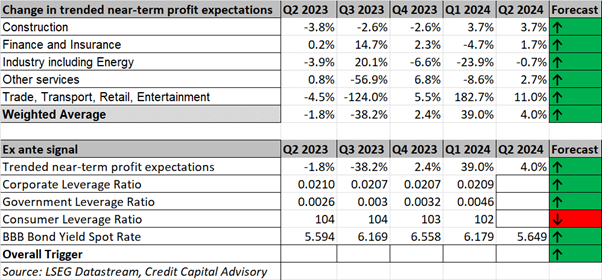
The most recent CCA U.K. quarterly credit cycle signal shows expected profit growth across all sectors, combined with a rising corporate leverage ratio, although the U.K consumer leverage ratio is down slightly.
Exhibit 6: U.K. Wicksellian Differential ex-ante Signal
To assess the future level of the U.K. Wicksellian Differential, investors will need to have a better understanding of where U.K. interest rates are headed.
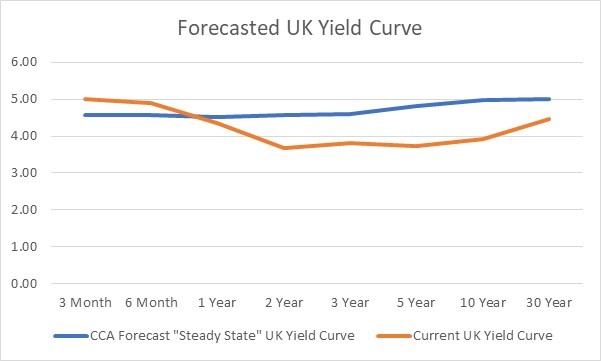
The CCA forecasted yield curve for the U.K. expects the base rate to level off at 4.5%, due to the fact that the labor market remains reasonably tight and the U.K. has become more of a closed economy since it exited the European Union.
However, the yield curve slope is forecasted to be shallower than in the U.S., partly because of the proportionally higher demand from investors for long-term assets to match their liabilities.
The data in Exhibit 7 suggest that the bond market is mispricing the five-year outlook which is the most important maturity for firms borrowing to invest. However, given the overall outlook for U.K. profits and the time it will take for the bond market to shift upwards, this is unlikely to derail the U.K. recovery in the short term.
Exhibit 7: CCA U.K. Yield Curve Forecast
Source: LSEG Datastream, Credit Capital Advisory
The battle between the monetary authorities and the bond market will no doubt continue. If the monetary authorities continue to be data-driven, and the data continue to be positive which appears on balance likely, there is not much of a case to rapidly and significantly reduce interest rates.
Indeed, given the higher levels of labor productivity and the anticipated increase in the marginal productivity of capital (which is required if average returns are increasing), both of which have some influence on r*, a longer run rate of somewhere closer to 4% appears increasingly more likely than 2.5%.
This means that we can continue to expect bond market volatility as investors periodically realize their mistakes.


