“Stuck in the Middle with You” Stock Market (and Sentiment Results)…
2023.04.06 12:36
As you can see in the chart above, there have been no gains for the S&P 500 for 12 months, and there have been no gains in the S&P 500 for 24 months. It is unchanged! As the old saying goes, markets can correct in price or in time. In this case it has been working off its excess post-covid run for two years, while earnings have continued to press forward:
During this two year slog of “hurry up and wait,” Steelers Wheel lyrics described the landscape perfectly:
Clowns to the left of meJokers to the rightHere I am stuck in the middle with you…
From the Cassandras (Clowns) who have continuously warned that the sky is falling, to the Pollyannas (Jokers) who insisted every day should be up, at the end of the day, NOTHING HAPPENED…
The good news is, resolution is near. According to Jonathan Levin at Bloomberg:
I’m with the jokers and think this resolves higher. While the Cassandras (Clowns) always sound more sophisticated, the Pollyannas (Jokers) wind up with all of the money over time as the market trends higher 70% of the time. If the Roulette wheel had 70% black and 30% red colored pockets on the wheel, and there was no penalty for sitting there all night, where would you place your bets?
On Tuesday evening I joined Phil Yin on CGTN America to discuss Jobs, Inflation, Stock Market Outlook, Earnings, and Banks. Thanks to Phil and Ryan Gallagher for having me on:
As you can see in my show notes below, what I planned to cover and what we actually covered are two different things! You can benefit from both versions:
Markets Overview: Positioning and Sentiment
Bank of America (NYSE:) Global Fund Manager Survey
At levels seen at/near market lows:
- Investors more bearish than: Pandemic Low (2020), Debt Crisis Lows (2011), and GFC lows (2009).
- Recession fears have come off highs as they did post March 2009 and April 2020 (after market bottoms).
- Cash Allocations coming down but still elevated – similar to levels after previous bottoms.
- Managers still overweight Bonds/Cash and Underweight US Equities and Tech.
MARKETS DON’T TOP WHEN MANAGERS ARE OVERWEIGHT BONDS AND CASH. THEY TOP WHEN EVERYONE IS OVERWEIGHT STOCKS WITH LEVERAGE AND THERE ARE NO MARGINAL BUYERS LEFT. WE ARE NOWHERE NEAR THIS LEVEL.
FED 0-1 more hike means rates subdued.
What works when tightening cycles are ending (rates moderating) and growth is below trend? REITS and Healthcare.
2 major “out of favor” picks (our specialty). Need Strong Stomach and 12-24 month holding period. Buy when there’s blood in the Streets:
VNO (starter position) initiated in March. 12-24 month+ hold (can be double +).
From Pre-Pandemic (2019) Levels:
-Rental Revenues down 4.9%
-Book Value per share DOWN 16.45%
-FFO (Funds From Operations) per share down 9.74%
-Occupancy rate in their NYC properties 90.4% down from 91.3% (down 0.9%)
-Stock Price Down 75%
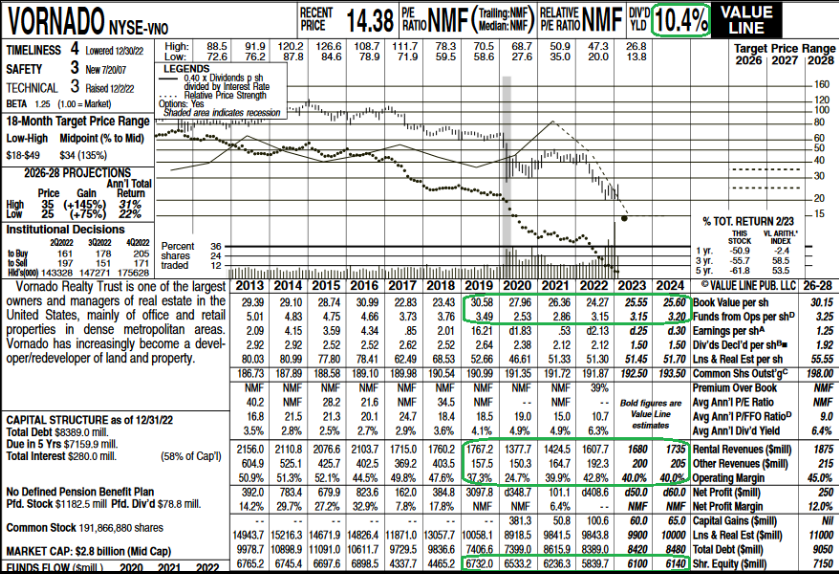
-THESE DIVERGENCES BETWEEN PRICE AND FUNDAMENTALS IS WHERE BIG GAINS ARE MADE OVER TIME. AS BEN GRAHAM SAID, “MR. MARKET IS A MANIC DEPRESSIVE.” TAKE ADVANTAGE OF THE EMOTIONS VERSUS BEING AT THE EFFECT.
-Already cut dividend in Jan (43% from 2019 levels). Yield still above 10%. Plenty of room to cut again if needed, but unlikely.
-Trading at 40% discount to book.
–If they didn’t take Steve Roth out on a stretcher during the GFH in 2008-2009 (trading at same levels today), it’s not going to happen now. He’s one of the best operators in the business.
-Similar to MALL crisis a few years ago. “B” & “C” properties were taken out. “A” properties (SPG) made it through fine.
-Vornado is Park Ave, Madison Ave, 5th Ave, 6th Ave, 7th Ave, Central Park South, Times Square (NYSE:), Penn Station, Lexington. Simply put, they own the best properties in the best city in the world. If you think demand is dead for that, there’s a lot more to worry about than Steve Roth.
Healthcare: Basket of biotech (XBI). Fed at or near end of tightening cycle. XBI Bottomed in May, traded sideways for months. Recent retest/pullback will hold.
We believe the move is just beginning and should be strong over next 1-2years (in a slower GDP growth environment). Similar situation in 2015-2018 (crashed 50% due to tightening cycle, up ~135% over next 2 years off low).
-Besides historic low valuations – whether you look at Price/Sales, Price/Book, Price/Operating Cash Flow, Forward P/E, Percent trading at a discount to cash, etc the key catalysts are drugs and deals. Pfizer (NYSE:) buying SGEN for $43B was tip of iceberg.
BofA quantitative study of where Biotech stocks are trading as a group (relative to their historic average multiple) implies the sector should appreciate:
>25% – to get back to average Price to Book multiple
>155% – to get back to average Price to Operating Cash Flow multiple.
>110% – to get back to average Forward P/E multiple.
Big Pharma has record cash and patent cliffs. Will have to buy innovation and growth. The cash balance of Russell 3000 companies exceeds $500B. This is up ~400% in the past 20 years.
Drug approvals have been coming in fast and furious since the focus has shifted from COVID (2020-2022) back to normal innovation (Alzheimer’s, Cancer, etc).
Another “Uninvestable” Stock
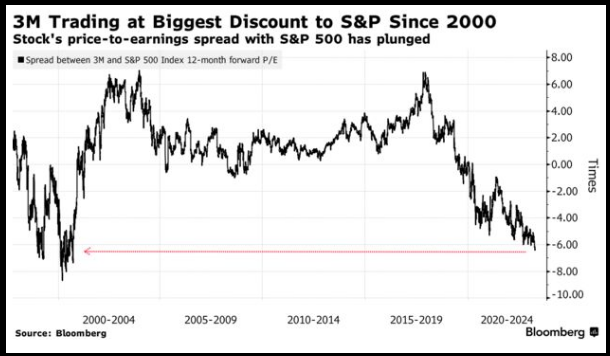
3M Trading at Biggest Discount to S&P Since 2000
Over the weekend, Bloomberg quoted an analyst from RBC (TSX:) who called 3M (NYSE:) “uninvestable.” This is a company we have started speaking about in the last couple of weeks on our podcast|videocast. They have compounded capital above 20% per year for over a decade. It is down on the basis of litigation risk for PFAS (“forever chemicals”) and combat earplugs. Reasonable analysts reserve ~$18B (over many years) for the total exposure:
U.S. Department of Defense records for more than 175,000 plaintiffs in the Combat Arms earplugs lawsuits showed most of them had normal hearing.
The Australian government maintains there is limited to no evidence that exposure to PFAS significantly harms human health.
Unreasonable analysts see the liability as much as $100B. Considering what we saw today with JNJ settling their talc powder lawsuit for around ~$8.9B (despite claims that it directly caused cancer), I would take the UNDER on total exposure.
Assuming an unrealistic LOSS in the suits totaling $30B paid out over 10-30 years, it would not materially impair the intrinsic value of the business at these levels. They could simply cut the dividend (which costs ~$3.3B/yr) and pay out the liability over 1-3 decades – while continuing to compound capital (intrinsic value) above 20% per year moving forward.
 Return Ratios / Margin Analysis
Now onto the shorter term view for the General Market:
In this week’s AAII Sentiment Survey result, Bullish Percent (Video Explanation) jumped up to 33.3% from 22.5% the previous week. Bearish Percent dropped down to 35% from 45.6%. Retail fear is thawing…
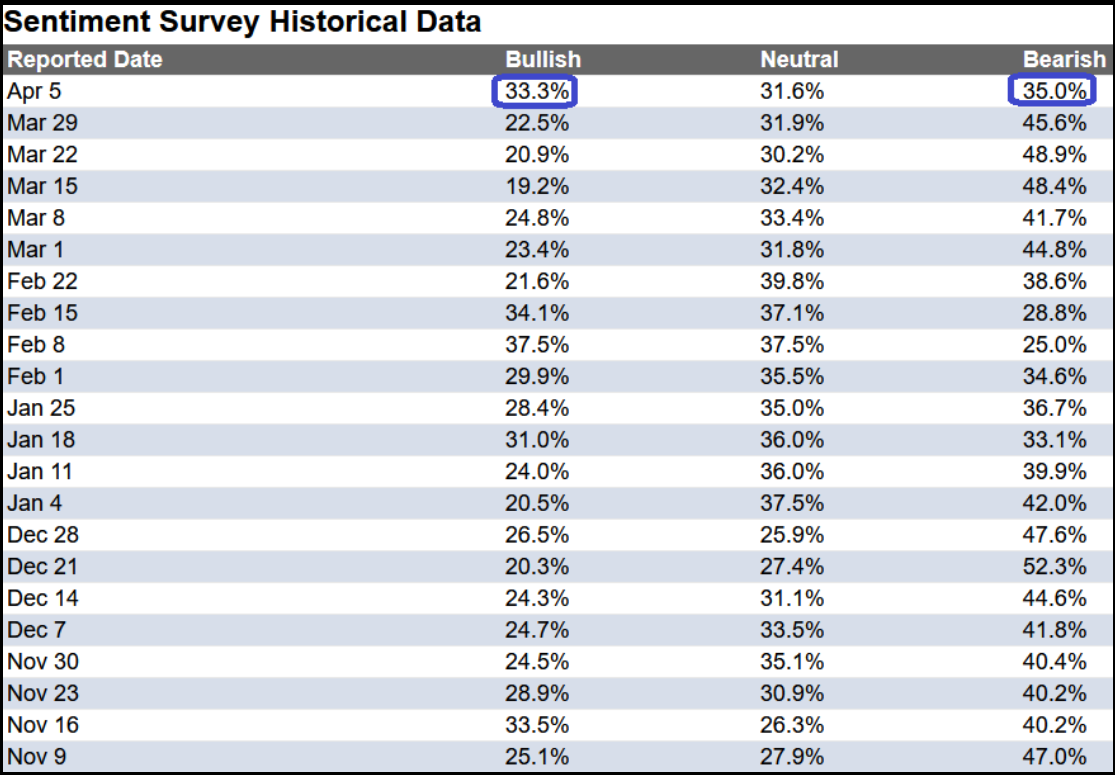 Sentiment Survey Historical Data
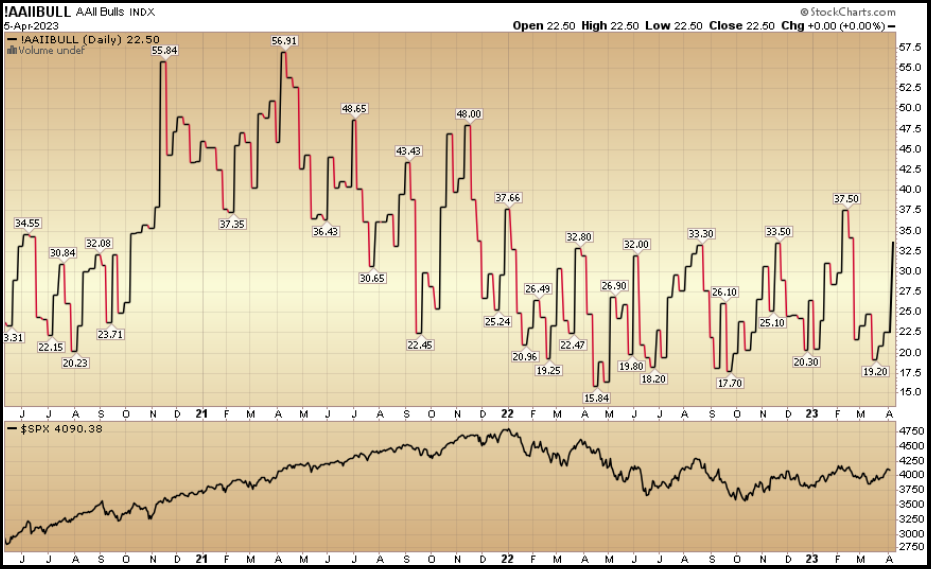
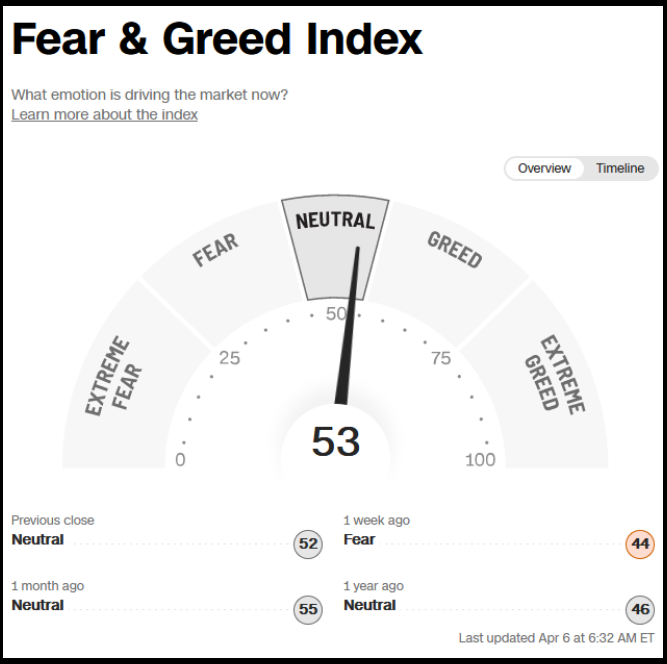
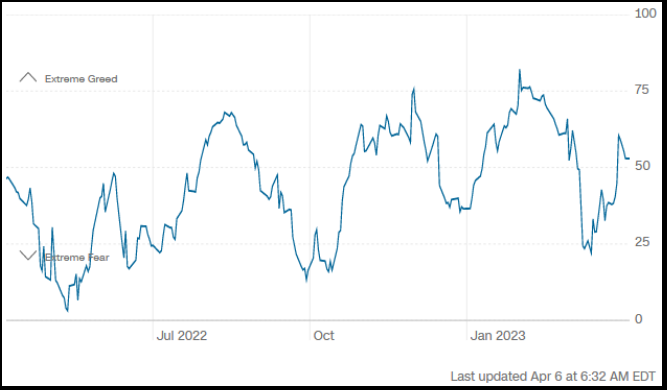
The CNN “Fear and Greed” rose from 40 last week to 53 this week. Sentiment is neutral. You can learn how this indicator is calculated and how it works here: (Video Explanation)
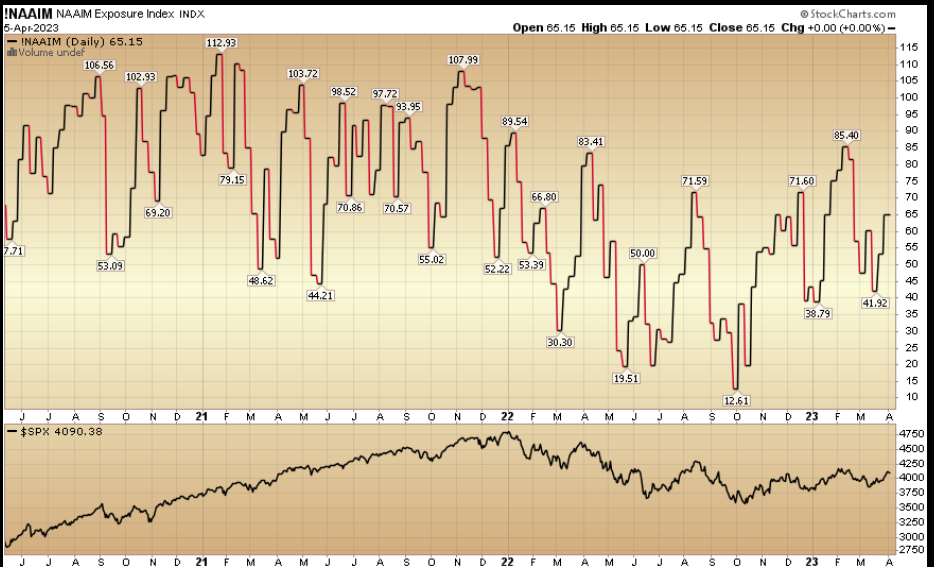
And finally, the NAAIM (National Association of Active Investment Managers Index) (Video Explanation) rose to 65.15% this week from 53.21% equity exposure last week.
This content was originally published on Hedgefundtips.com.


