
Oil Hesitates Facing Speculation, Winds From All Sides
2022.09.29 12:52
[ad_1]
Aggressive monetary tightening policy, the energy crisis in Europe and China’s continued zero-COVID policy are all dragging on the oil market.
Geopolitics
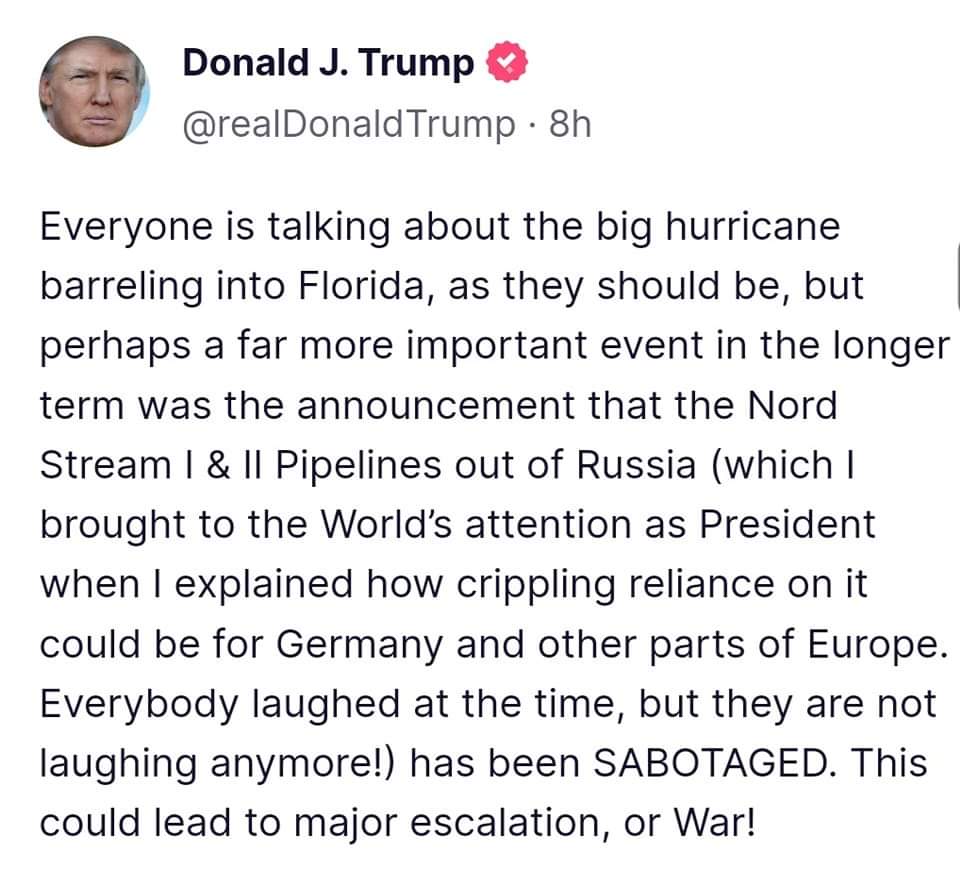
The recent events on both pipelines (North Stream 1 and 2) have raised the question of sabotage.
Currently, it is difficult to find out who led such explosive operations (at least three) in the Baltic Sea but that it is not going to help a de-escalation of the Russia-Ukraine war, even though international investigations have begun.
Meanwhile, former U.S. President Donald J. Trump suggested mediating a peace agreement between Russia, Ukraine and the United States through a few posts on “Truth Social,” his social media network:
Macroeconomics
On the macroeconomic view, the has kept rallying above its previous swing high.
As I expected in my two previous articles, the quarterly R3 pivot (around $115) became the new target. So, it is where the market stopped after making a new high at $114.778 yesterday.
Therefore, a strong dollar tends to reduce the purchasing power of investors using other currencies.
 US Dollar Index Daily Chart.
The Weather
The market initially reacted to the evacuation of 12 oil rigs located in the Gulf of Mexico in anticipation of the passage of Hurricane Ian, which swept through Florida on Wednesday.
Fundamental Analysis
Speculation of a production cut by OPEC+, which will meet next Wednesday, is weighing on prices.
Indeed, OPEC+ could decide on a drop in production to galvanize prices – a scenario anticipated by investment banks such as UBS or JPMorgan.
Commercial crude oil reserves fell slightly last week in the United States, according to figures released on Wednesday by the US Energy Information Agency (EIA), as analysts expected a sharp rise in inventories.
U.S. Crude Oil Inventories
On Wednesday, the Energy Information Administration (EIA) released the weekly change in the count of barrels of commercial crude oil held by U.S. firms.
During the week ended Sept. 23, oil stocks fell by 215,000 barrels, when the consensus, established by Bloomberg, was counting on an increase of 2 million barrels (so, almost five times as much as the forecasted figure of 443,000 barrels).


Oil Inventories Chart.
Source: Investing.com
In the context of the energy crisis in Europe and sanctions hitting Russia, U.S. crude is in high demand.
On average over four weeks, crude oil exports are about 40% higher than they were last year at the same time.
In addition, the drain on U.S. strategic reserves was significantly lower than in previous weeks, at more than four and a half million barrels.
U.S. Gasoline Inventories
As for gasoline reserves, they have shrunk by almost 2.5 million barrels, while analysts expected an increase of almost half a million barrels.


Gasoline Inventories Chart.
Source: Investing.com
Technical Analysis
On the daily chart, (November contract) has been falling again into the lower band before bouncing back above its mean regression line (or median of its regression channel) currently starting from May-20 on the daily chart to get a Pearson’s R (coefficient) near 0.87, with a 4-month long correlation of almost 87% for WTI, 90.3% for RBOB Gasoline, and almost 93% for (see the charts below).
 Crude Oil Futures Daily Chart.
WTI Crude Oil (CLX22) Futures (November contract, daily chart)
 RBOB Gasoline Futures Daily Chart.
RBOB Gasoline (RBX22) Futures (November contract, daily chart)

Brent Crude Oil (BRNX22) Futures (November contract, daily chart) – Contract for Difference (CFD) UKOIL
[ad_2]
Source link


