Oil Demand Has Fallen, but It’s Not All Doom and Gloom
2023.12.07 02:46
- For all the talk of recession, oil demand has held up relatively well.
- Although falling demand played a role in the recent oil rout, upside surprises in US and OPEC+ production in addition to speculators selling oil futures en masse are to blame.
- While Chinese demand growth has failed to meet expectations, US demand in particular remains robust. Both should continue to improve as we enter 2024.
- Given that speculators are nearly as bearish as they have been in years and oil sentiment overall is as bad as it gets, means we could be setting up for another move into the low $90’s at some point in the months ahead.
- For now, short-term indicators remain neutral to bearish, so a little more patience is likely required as the oil market healing process continues.
Energy Demand Is Holding Up Relatively Well
Speculative selling within the market based on recession fears has been a mainstay within energy markets for nigh on two years now. And, while oil demand has softened of late and this softening did play some role in the recent rout in oil prices, the recent sell-off has been much more a consequence of hedge funds and CTA’s selling crude left, right and center, along with US and OPEC+ production exceeding expectations.
Although oil demand isn’t shooting the lights out, it isn’t falling off a cliff either. And again, even though Chinese demand growth from their reopening has disappointed to a certain extent and remains below pre-COVID levels, we have seen significant improvements from China throughout the year.
As we can see below, according to Morgan Stanley, the biggest drivers of crude demand this year have come from China, while jet fuel is the petroleum product whose demand continues to benefit most from the world’s slow return to pre-COVID norms. Unsurprisingly, the same cannot be said of European demand as the region continues to struggle with an obvious economic downturn.
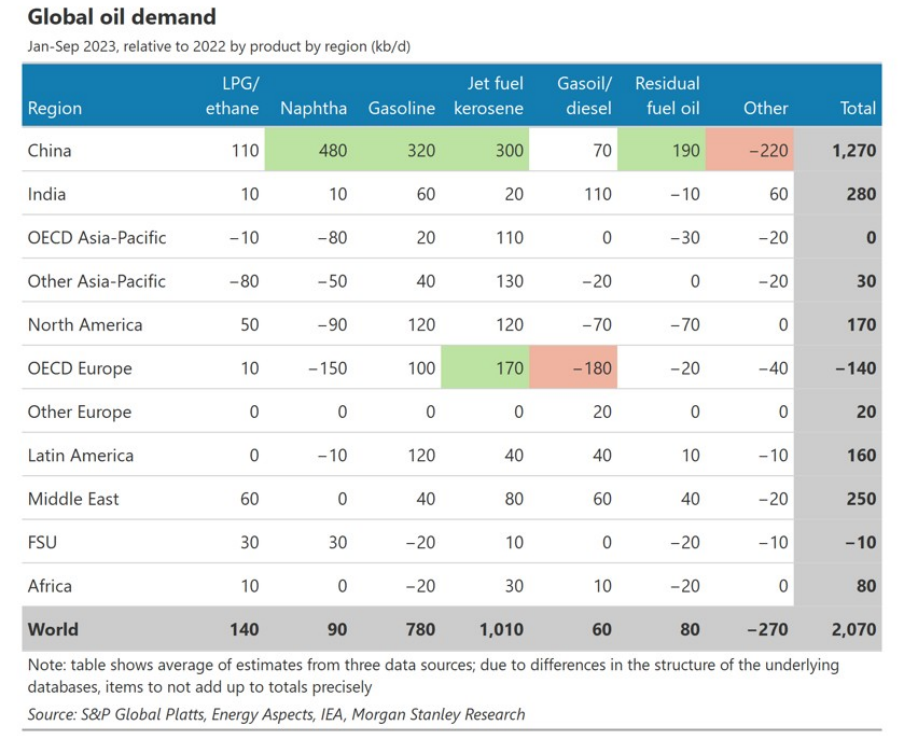
Source: Morgan Stanley
In the US, the demand picture is holding up well. The below chart is comprised of the EIA’s monthly consumption data as of September, with the October to November data being the four-week moving average of the EIA’s less reliable implied weekly demand. As we can see below, as of September, total consumption of refined petroleum products had declined notably since peaking around mid-year (the height of summer driving season that coincides with peak gasoline demand), and has since rebounded as of November (though I suspect once the monthly consumption data is released for October and November, this bounce in implied product demand may not be quite as pronounced). Regardless, gasoline demand in particular has moved notably higher in recent weeks, with the same being said of diesel demand. In regards to jet fuel demand, demand remains strong as domestic and international flight travel continues to recover to it pre-COVID averages, as we saw above.
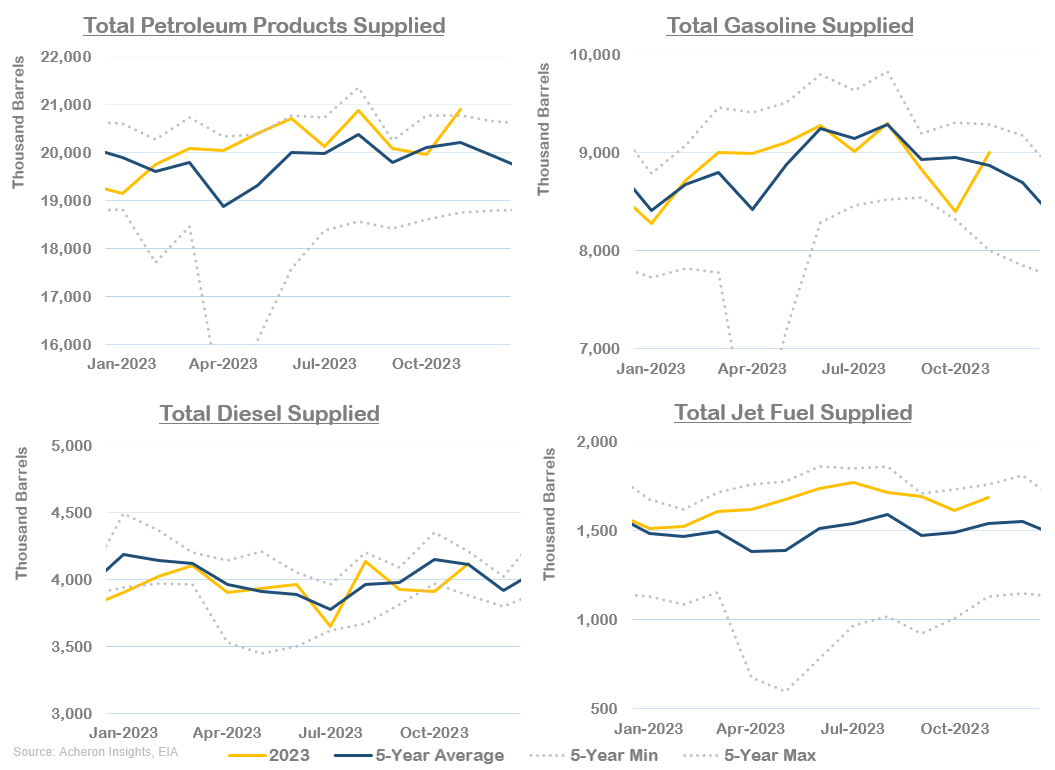 EIA’s Monthly Consumption Data
Breaking down US demand a little further, we can see that vehicle miles travel in the US (which you may be interested to know is highly correlated to gasoline consumption… who would have though) remains fairly robust, though has been declining over recent months. Still, we are seeing above-average vehicle movement in the US throughout 2023.
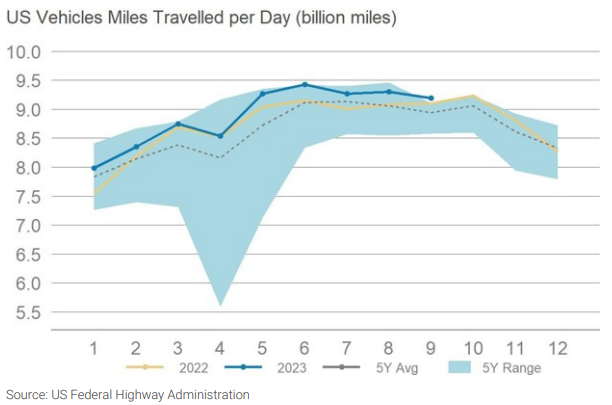
US Average Vehicle Movement
In terms of diesel, overall consumption has been roughly in-line with seasonal averages this year, as we saw earlier. Unlike gasoline demand, diesel demand is influenced by the whims of economic activity to a far greater extent, given its much greater use in heavy machinery, manufacturing, and freight.
As I detailed in depth here, we have seen a downturn in US manufacturing activity within the United States throughout 2022 and 2023, thus, this has impacted diesel consumption to a certain extent. The close relationship between the growth in diesel demand relative to manufacturing and freight activity is illustrated below.
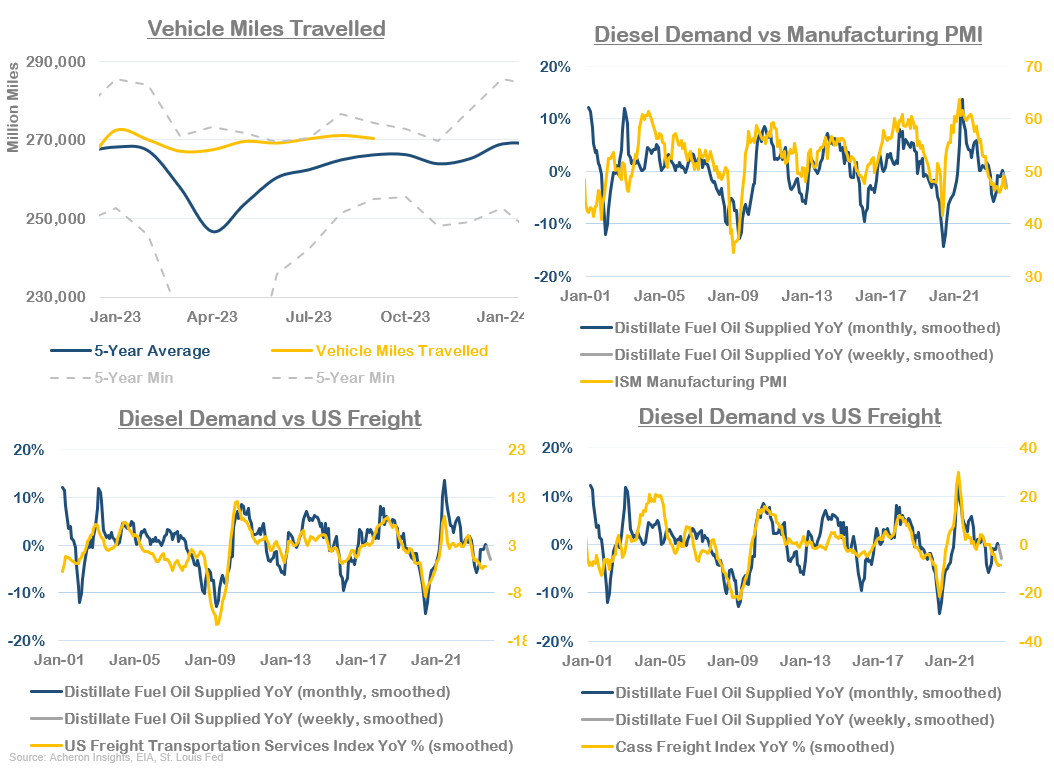 Demand Vs Manufacturing and Freight Activity
Importantly, if we are nearing a trough in the business cycle, which my analysis leads me to believe is likely, any uptick in manufacturing activity that may come in 2024 will ultimately be a boon for diesel demand, and thus overall crude demand.
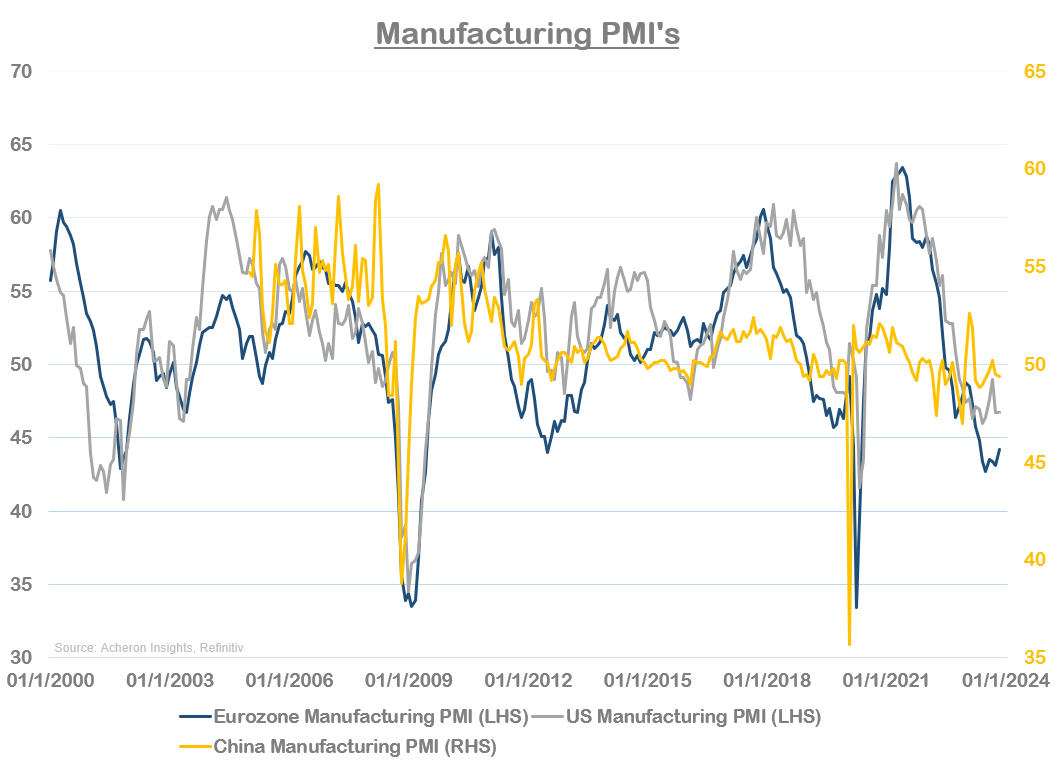
When it comes to global manufacturing activity, things in Europe have been noticeably weaker, with the Eurozone Manufacturing PMI current sub-45. China’s manufacturing recovery on the other hand has only been mild thus far. The lack of a significant Chinese recovery has been one the primary reasons why oil demand this year has failed to meet expectations, even though it has still grown moderately overall.
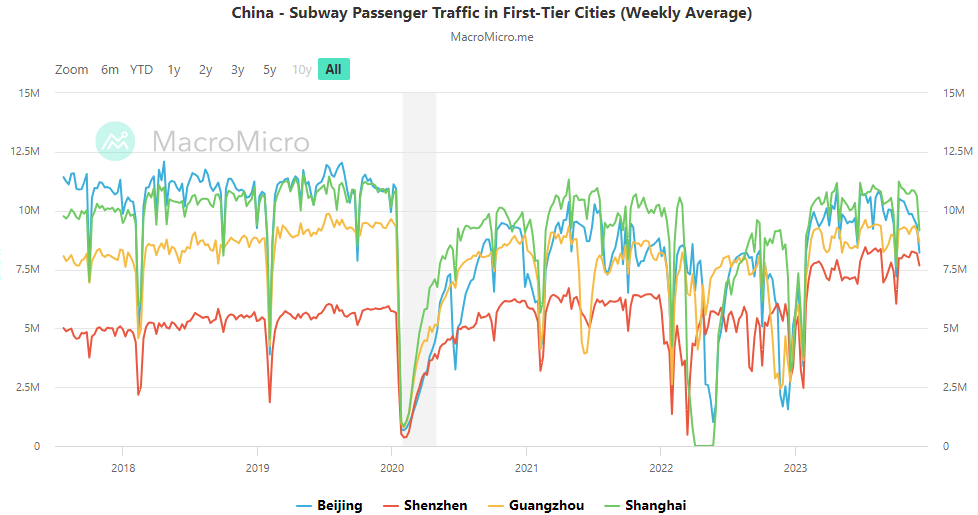
Digging deeper into Chinese demand, we can see below that the recovery in Chinese passenger travel has indeed taken place, but it remains below pre-COVID levels. I suspect this will continue to slowly trend higher as we progress through 2024.
One cause for concern in relation to Chinese demand however is the fact that Saudi Arabia has recently cut their Official Selling Price (OSP) of Arab Light Crude to Asian buyers (i.e. China) by $0.50. This is clearly a confirming data point to the notion the Chinese recovery in demand has not been what many expected it to be, and so too is the fact that OPEC+ was willing to extend their production cuts despite their demand forecasts being notably higher than the EIA and IEA.
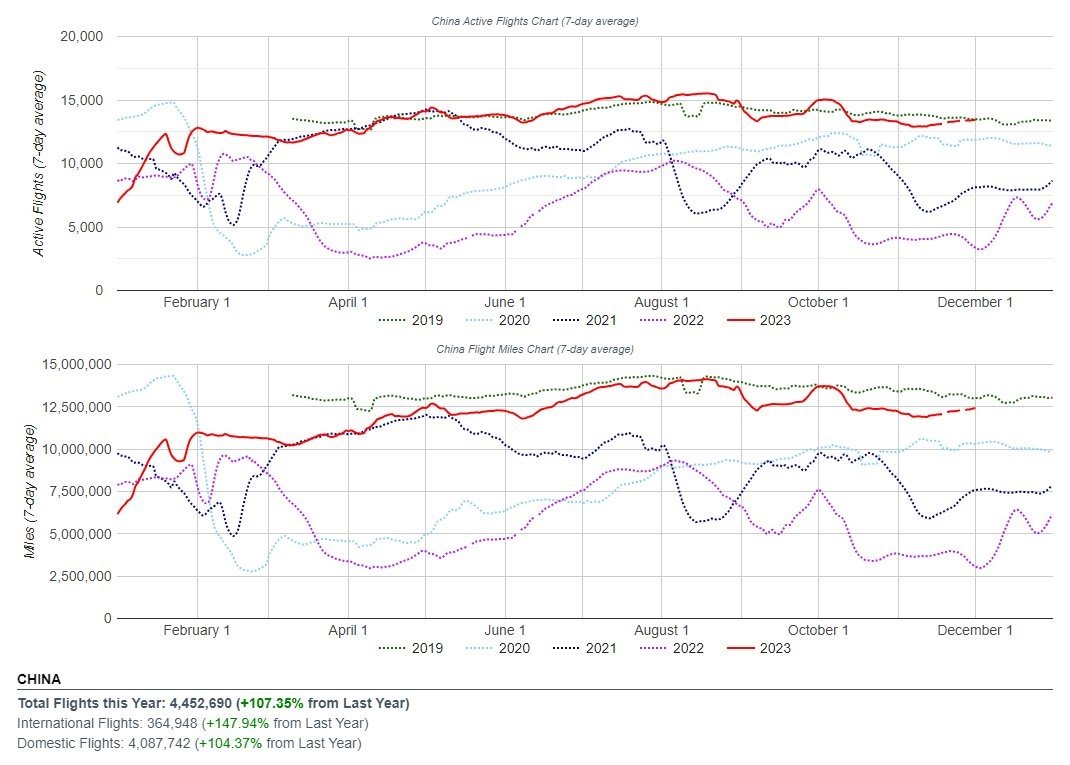
An area where Chinese demand is recovering relatively well however is air traffic, which is more or less back to pre-COVID levels.
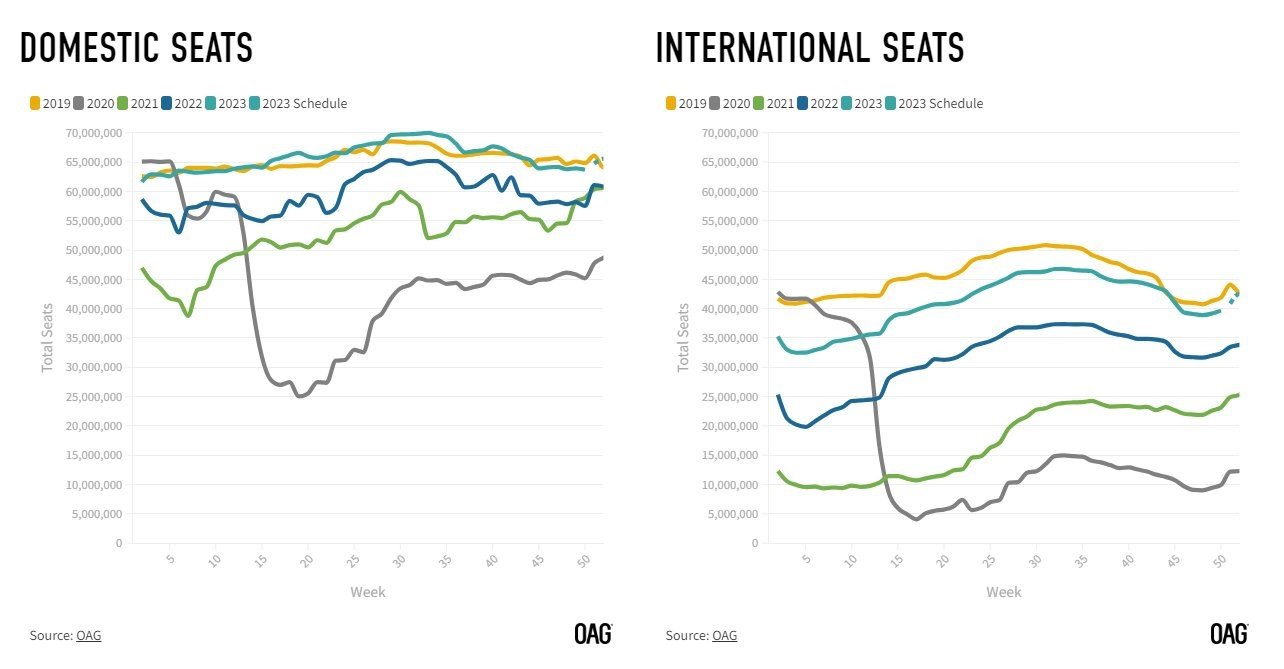
The same can be said of global air travel. These charts explain much of why demand for jet fuel remains well above seasonal averages.
Overall, demand is doing okay. Although Chinese demand has failed to meet expectations, it is improving. Furthermore, there is a good chance diesel demand picks up again come 2024 as the US and European economies recover from the current manufacturing downturn and the Chinese recovery continues.
It is important to remember also that much the weakness in demand we have seen of late (particularly about gasoline consumption) can be attributed to seasonality. The post-northern hemisphere driving season and Autumn months are particularly bearish for gasoline consumption and thus gasoline prices, hence why we see refinery utilization fall during the months of September and October.
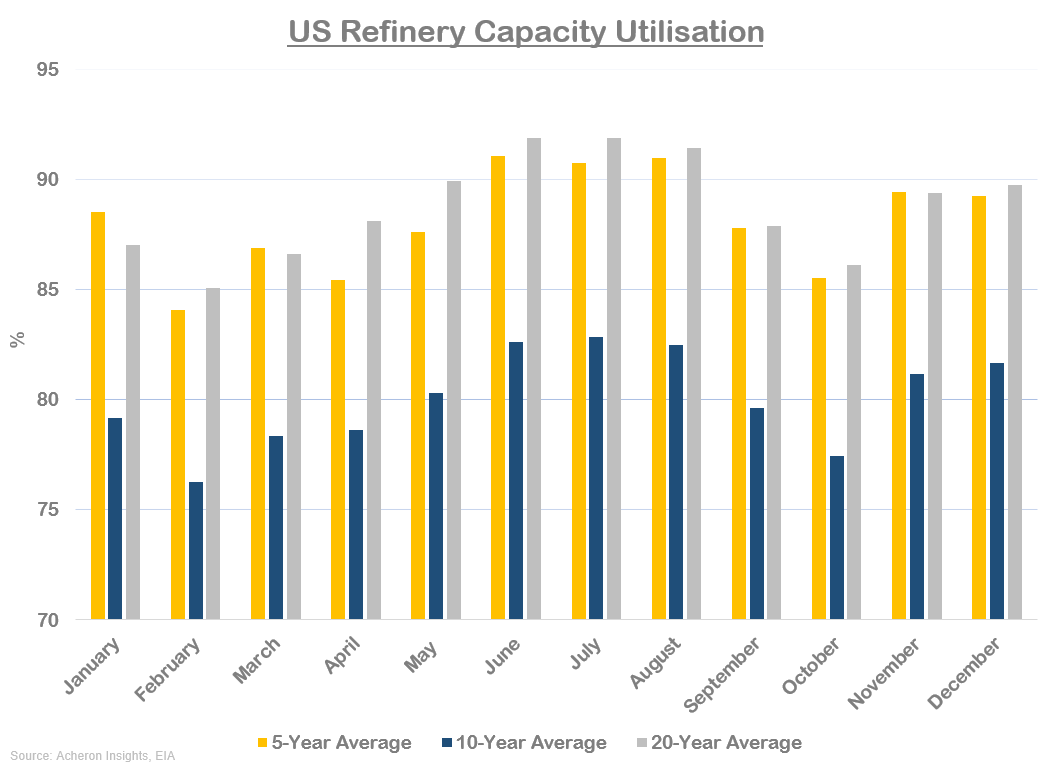 US Refinery Capacity Utilization
Fortunately, these seasonal headwinds are slowly reaching their crescendo.
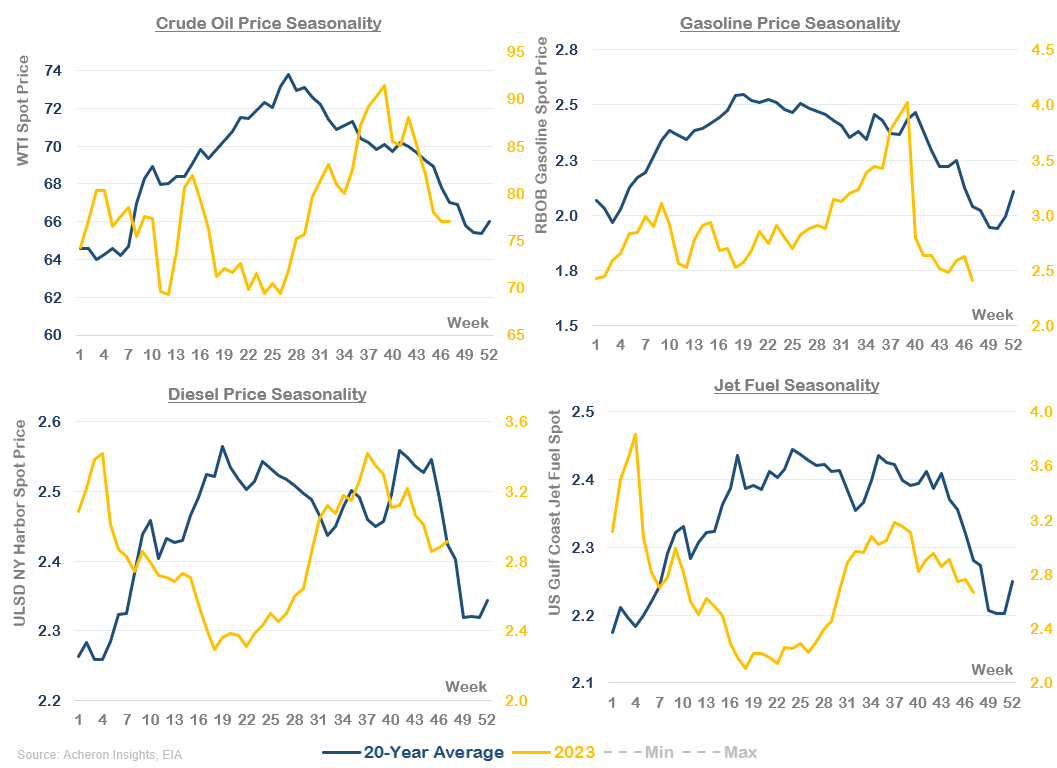
Looking forward, the question for oil prices is how much of any recovery in demand will be met by a commensurate response in supply by the likes of the shale, OPEC and Russia. Come Q1, we will probably see a neutral to slight deficit in supply relative to demand, which, given that speculators are nearly as bearish as they have been in years and oil sentiment overall is as bad as it gets, means we could be setting up for another move into the low $90’s at some point in the months ahead. Much of this will depend on how disciplined OPEC+ producers are at sticking to their quotas. For now, short-term indicators remain neutral to bearish, so a little more patience is likely required as the oil market healing process continues.


