‘Next Thing You Know’: Stock Market (and Sentiment Results)
2023.11.16 09:29
“Next Thing You Know” is a song co-written and recorded by American country music singer Jordan Davis. It was released on February 21, 2023. It was nominated for the Country Music Association Award for Single, Song and Video of the Year at the 57th Annual Country Music Association Awards. (wikipedia)
I chose this song as the theme for this week’s article because the lifetime progression he outlines in the song reminds me of when you apply a disciplined proven framework to your investing process and then you WAIT and let it play out as it always does. Sometimes sooner, sometimes later, but it always works over time when the framework is correct.
As I’ve stated many times, when it comes, it comes all at once. All you can control is the process – not the timeline. Some investments reach intrinsic value in six months and some take 36+. The key is buying durable proven cash generative businesses when they are temporarily impaired and then sitting on your hands until they are fully valued.
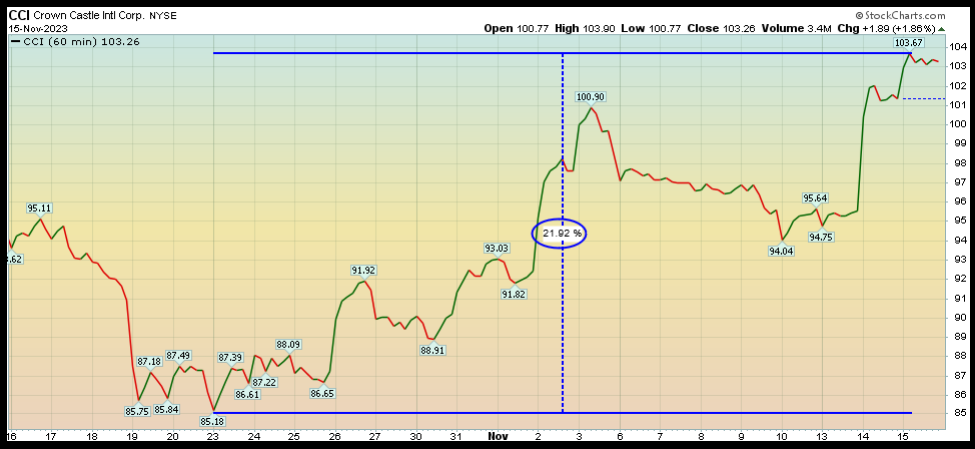
Here are a number of the positions/ideas we have discussed in on our weekly podcast|videocast(s) and in public media appearances:
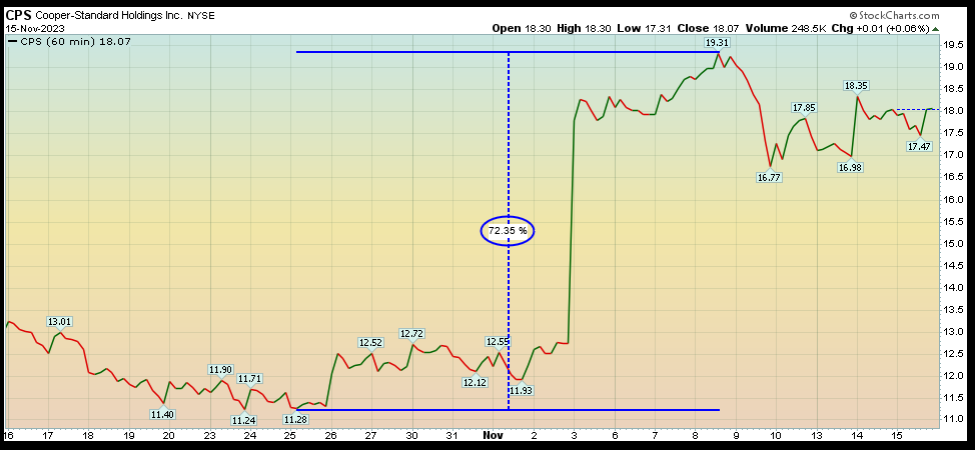 Cooper Standard Holdings Inc
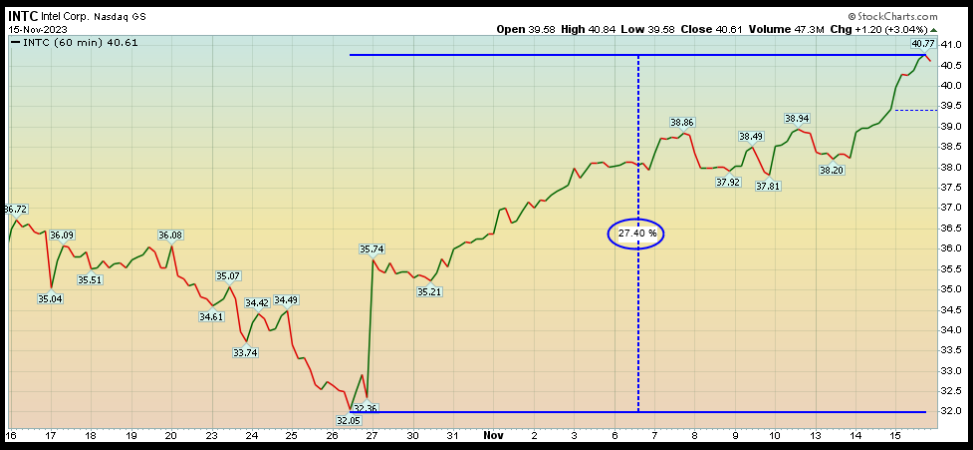
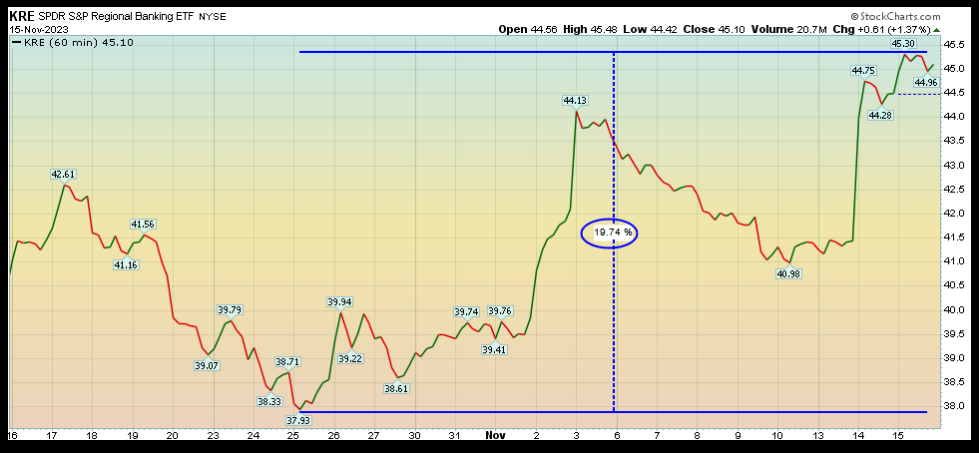 SPDR S&P Regional Banking ETF
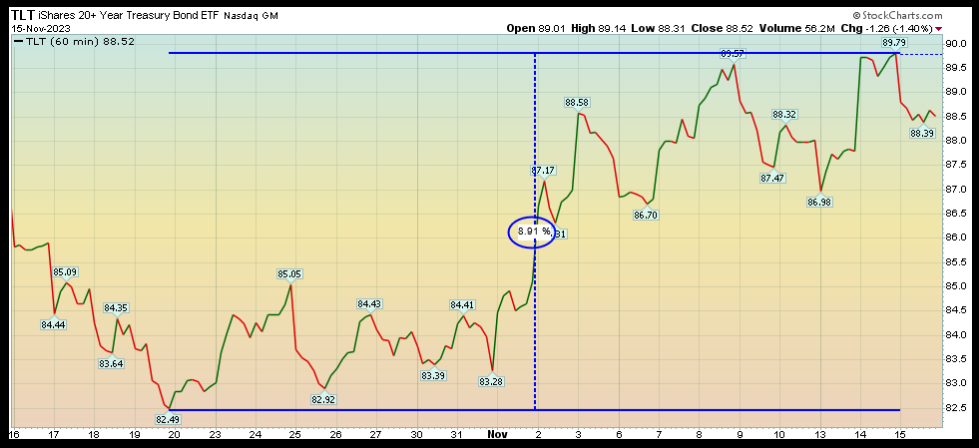 iShares 20+ Year Treasury Bond ETF
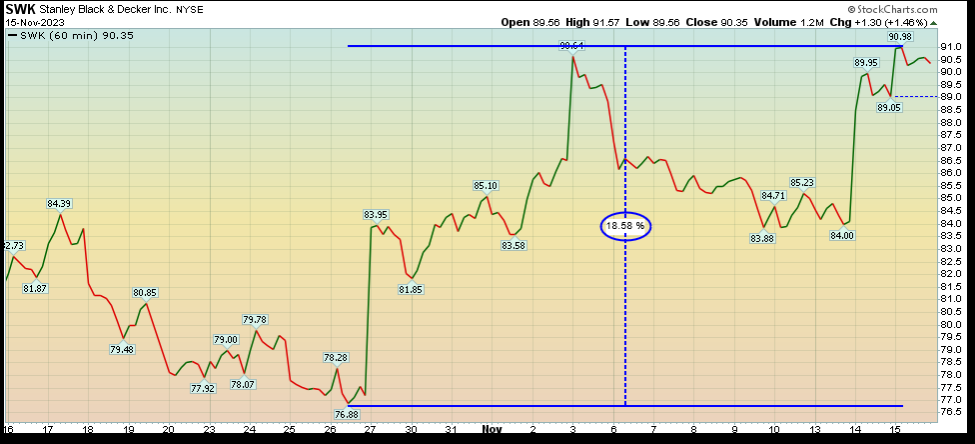 Stanley Black & Decker Inc
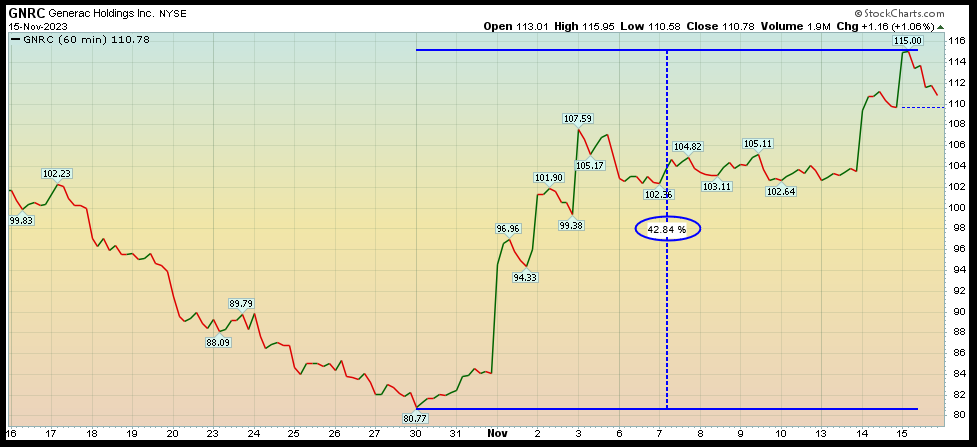
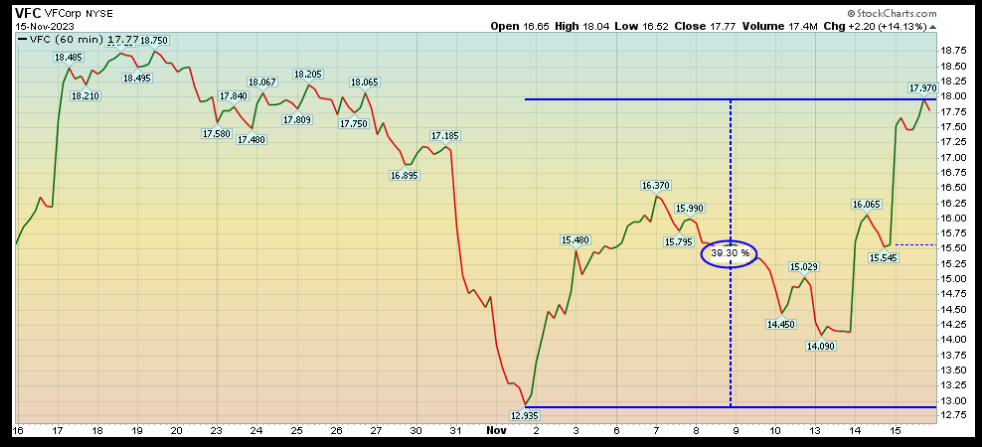
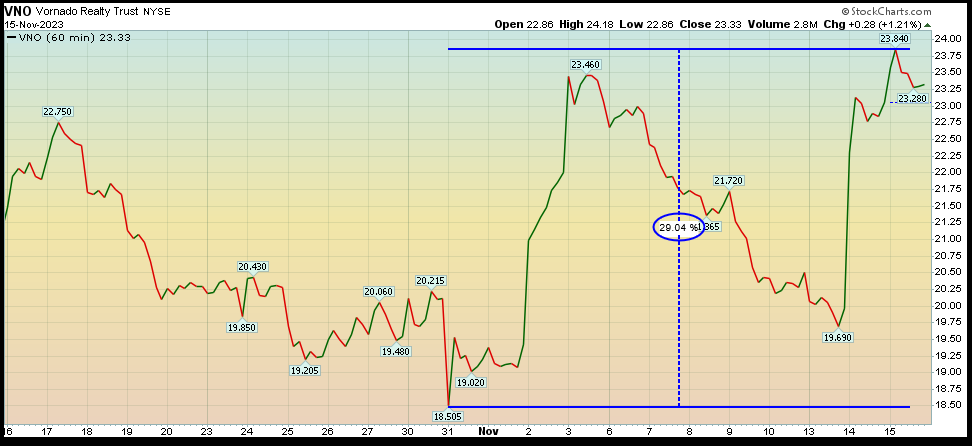
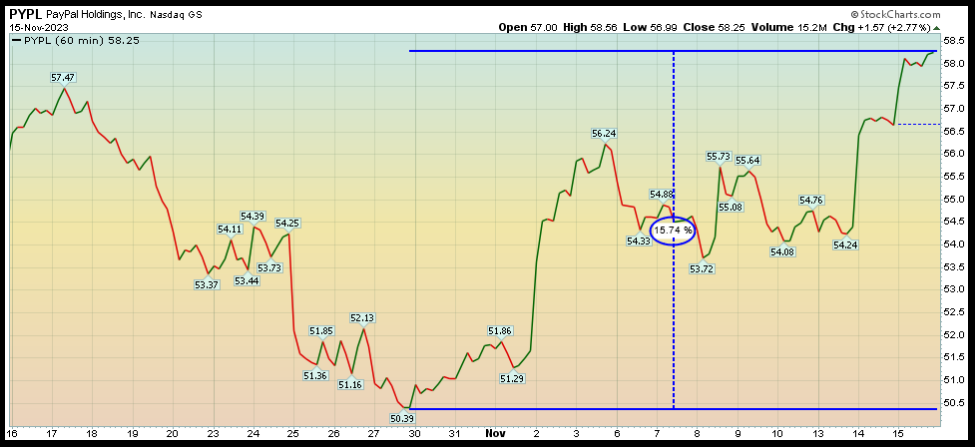
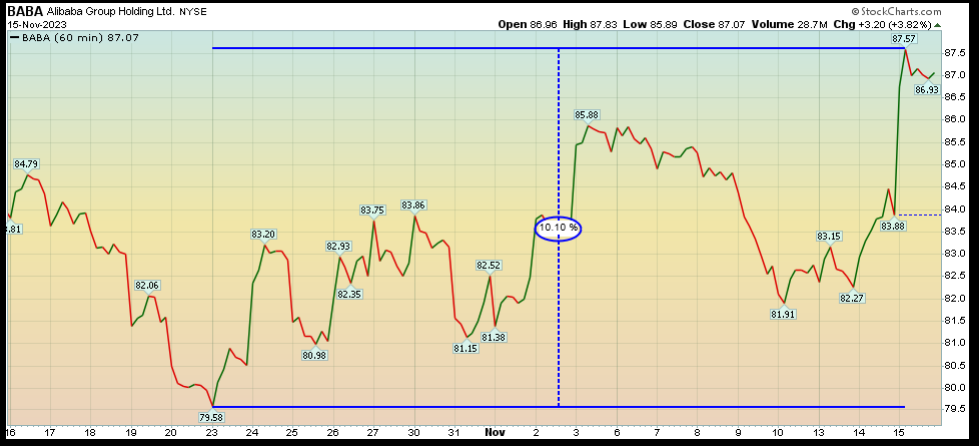
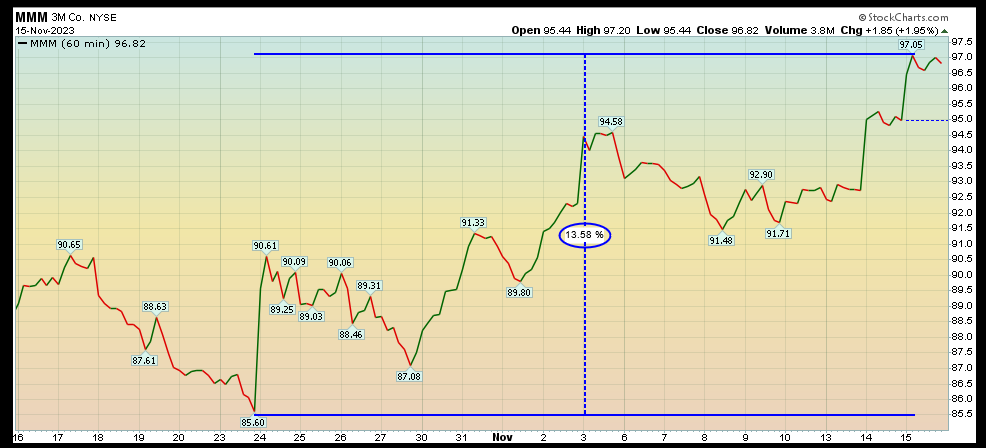
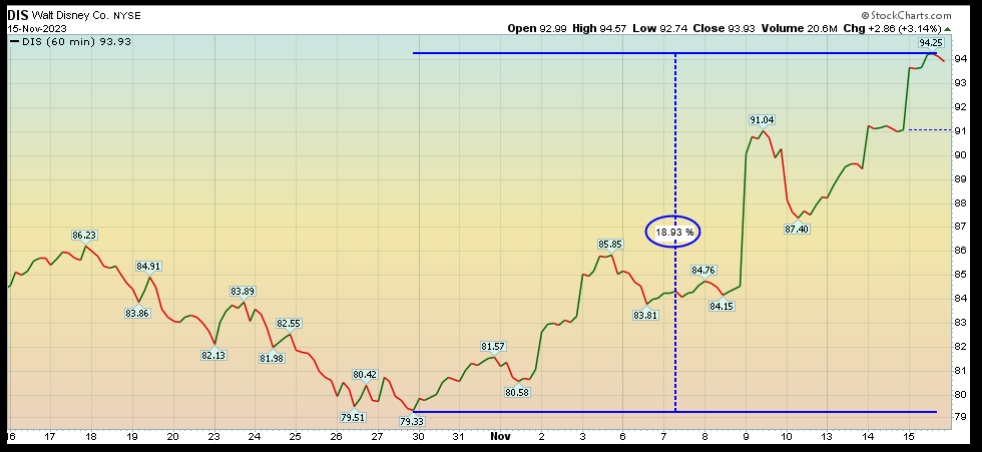
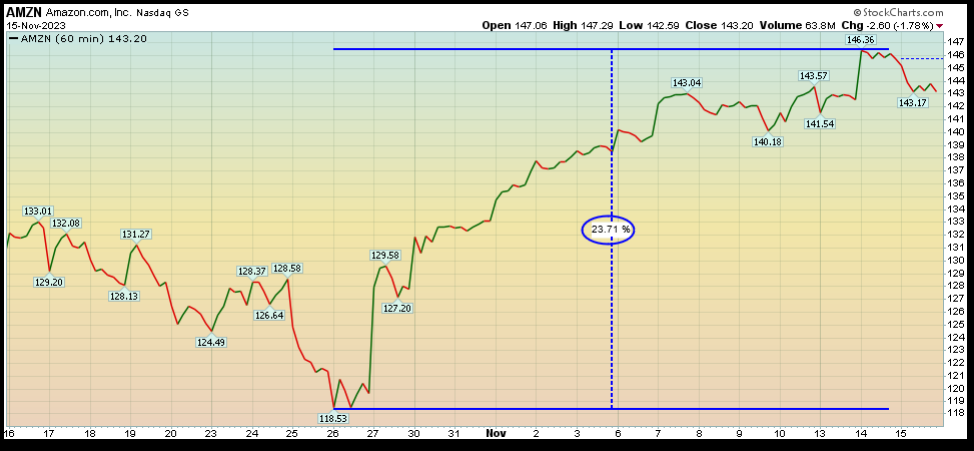
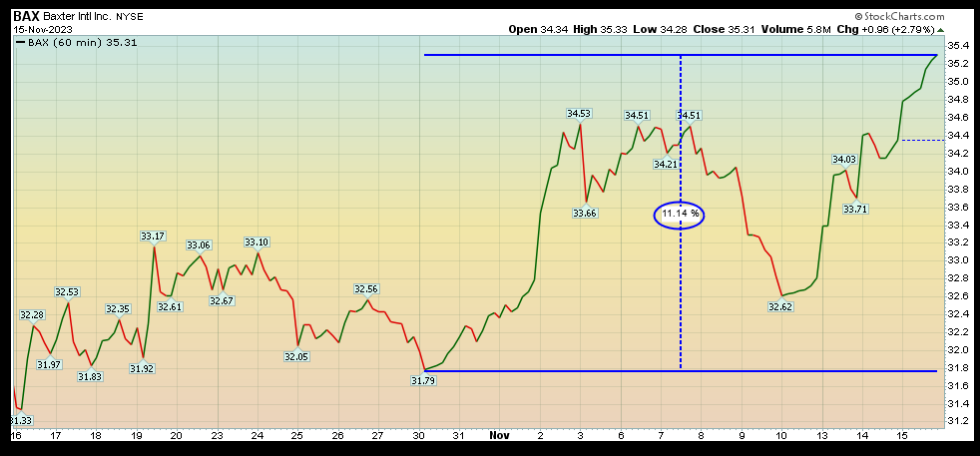
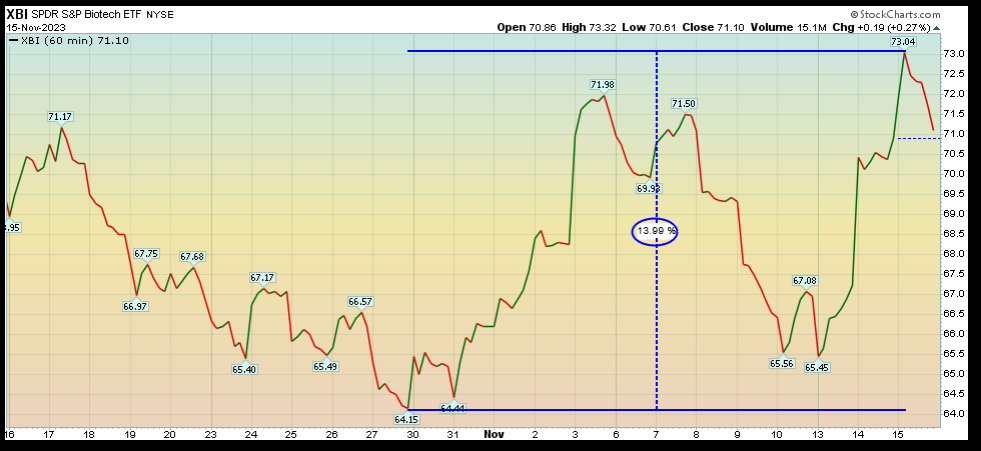
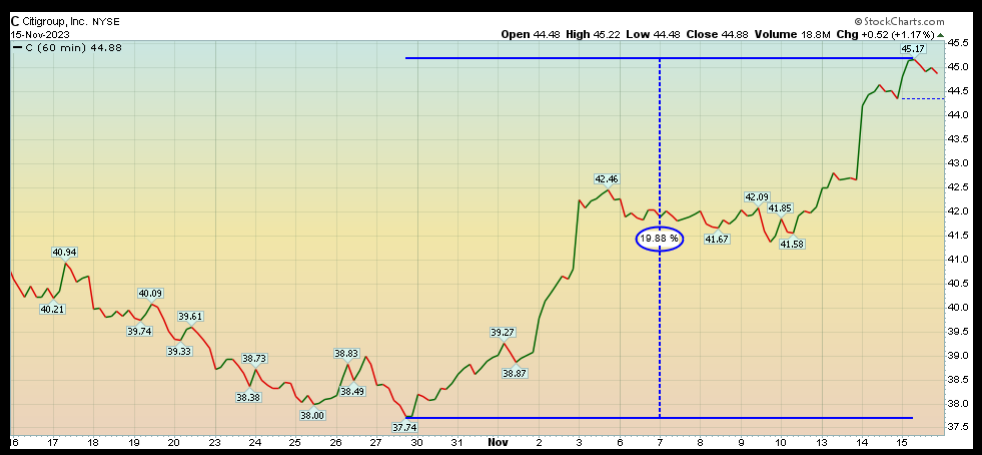
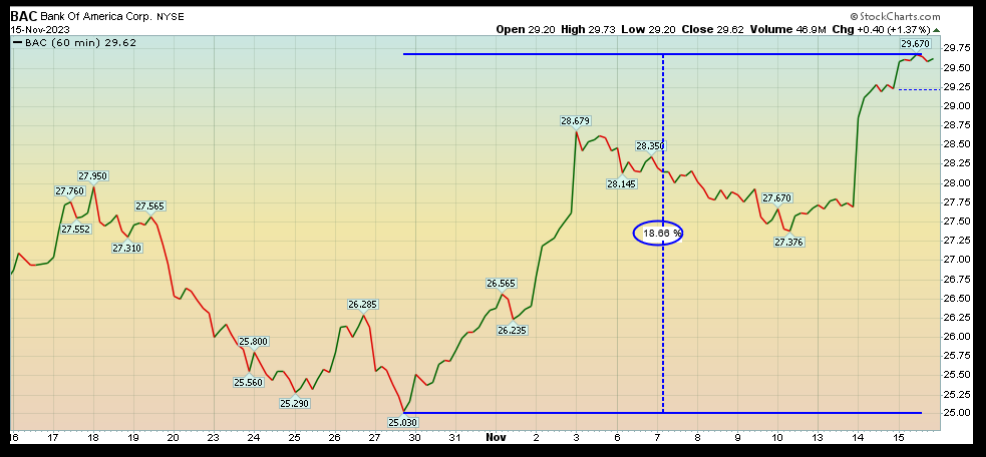
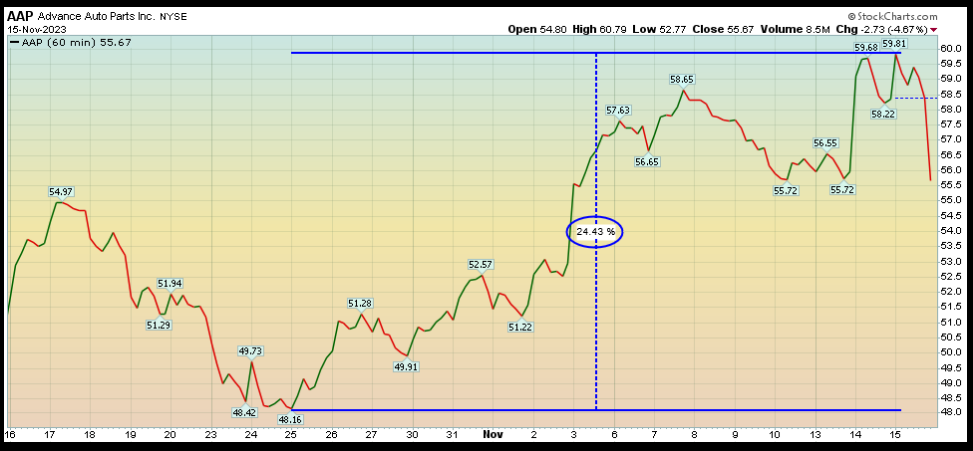
The best part is, that as much as it’s been nice to see all of these names move aggressively in the last few weeks – NOT ONE OF THEM IS NEAR OUR PRE-DETERMINED TARGET OF INTRINSIC VALUE. “Every battle is won or lost before it is ever fought” – Sun Tzu – The Art of War. In other words, most of these names are JUST GETTING GOING and still have many more months or years of runway before reaching fully valued status (and are sold). If you think you “missed it” you’re mistaken. The majority of these have just started leaving the station…
Fox Business
On Wednesday I joined Charles Payne to discuss two turnaround situations. One that is in the middle of its turnaround – Cooper Standard, and one whose turnaround is just beginning – Advance Auto Parts (NYSE:). Thanks to Charles, Nick Palazzo and Kayla Arestivo for having me on:
Watch in HD directly on Fox Business
Here were my “Show Notes” ahead of the segment:
2 Key Investing Themes For 2024
We have two major investment themes for 2024 that we outlined in our special presentation to Accredited Investors at the MoneyShow this week. This presentation is worth its weight in gold if you pay attention to some of the key charts in the middle. Thanks to Debbie Olsen, Mike Larson, Kim Githler and Shelly Coyle for having me on:
Full MoneyShow Power Point Presentation Download
CGTN America
Thanks to Phil Yin and Toufic Gebran for having me on CGTN America on Tuesday night to discuss inflation and its implication on the Fed and markets. Phil always asks the best questions so you definitely want to watch this one:
CNBC Indonesia
I joined Ade Nurul Safrina on CNBC “Closing Bell” Indonesia on Tuesday to discuss Emerging Markets, the US Dollar and more. Thanks to Safrina and Fitria Anggrayni for having me on:
And finally, I joined Jillian Glickman on Stock.app last week to discuss Alibaba (NYSE:), VF Corp (NYSE:) and Advance Auto Parts. Check it out here:
Sentiment & Positioning
This Tuesday, Bank of America (NYSE:) published its monthly “Fund Manager Survey.” I posted a summary here:
Here were the 3 key points:
1. Managers are still more pessimistic than they were at the March 2020 Pandemic Lows and March 2009 Great Financial Crisis lows. Markets will continue to climb the “Wall of Worry” until these managers are forced back in against their will. Always remember, “opinion follows trend.” As price moves up and they are pushed back in, they will be just as confident in their new bullish thesis as they currently are with their bearish one.
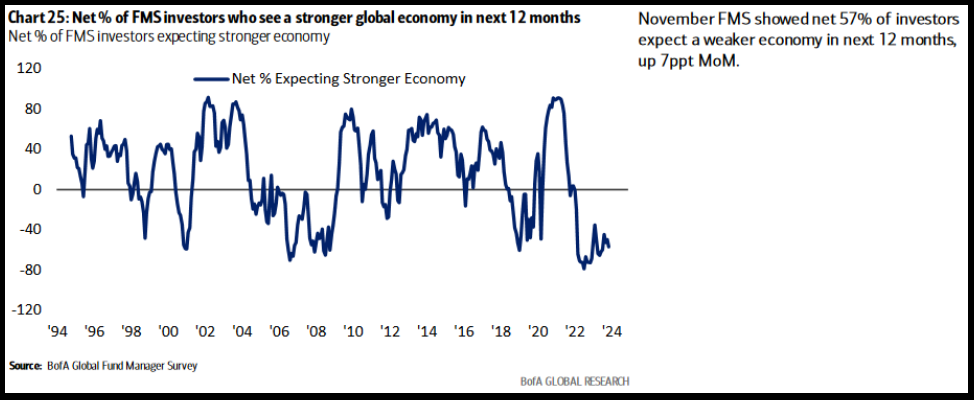 Net % of FMS investors who see a stronger global economy
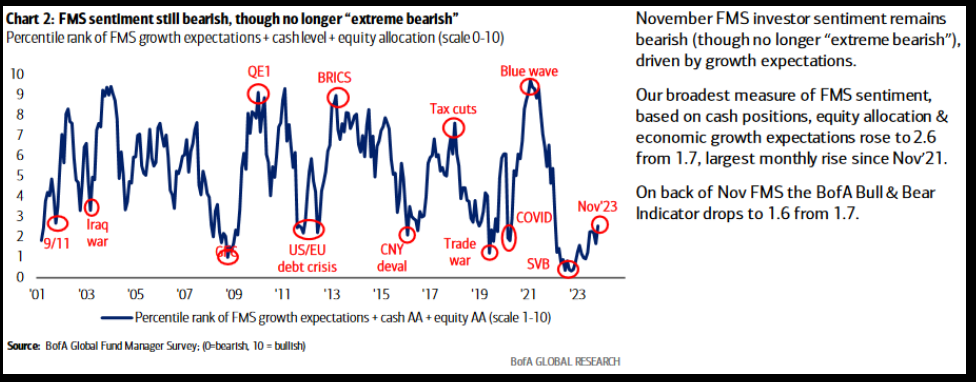 FMS sentiment sill bearish, though no longer
2. Managers love T-Bills and Cash. They hate Emerging Markets, China, REITS, UK and BANKS. Take the other side:
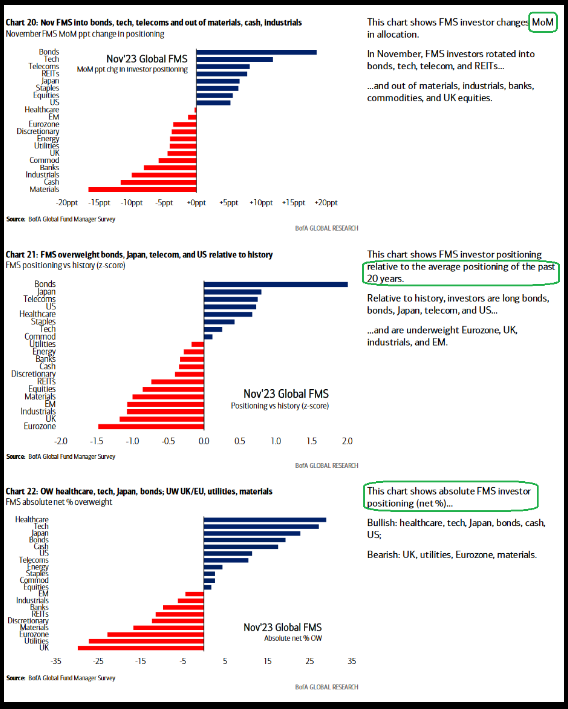
FMS investors
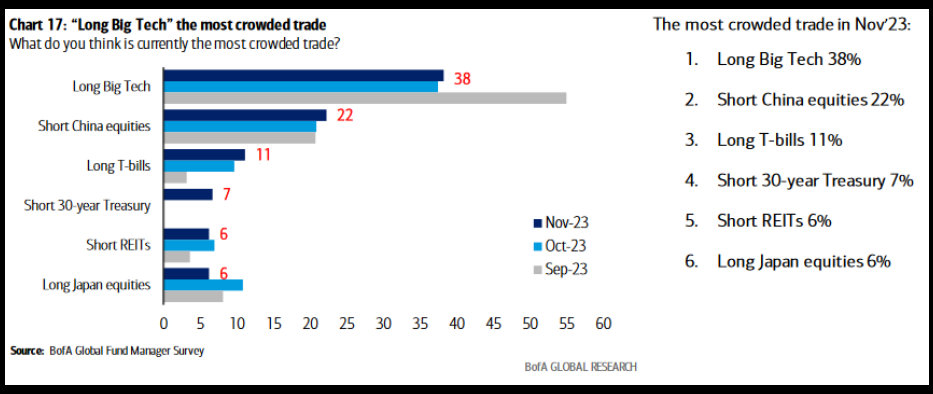 Long Big Tech – the most crowded trade
3. Managers are STARTING to come out of cash as the markets get away from them, but they are still too underweight risk assets and will have to chase:
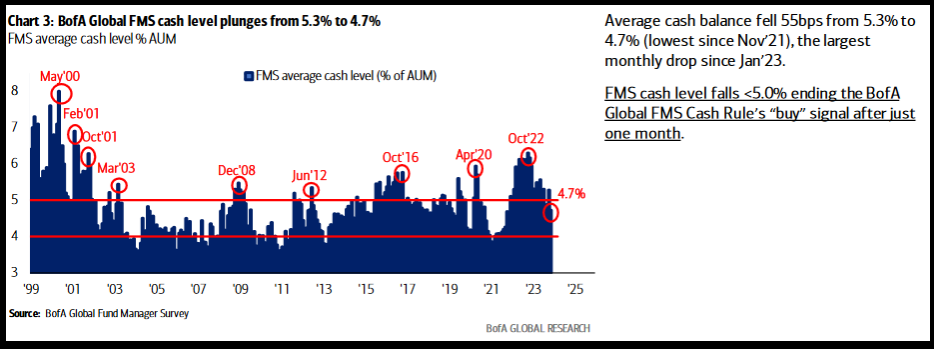 BofA Global FMS cash level plunges from 5.3% to 4.7%
2 year yield as signal…
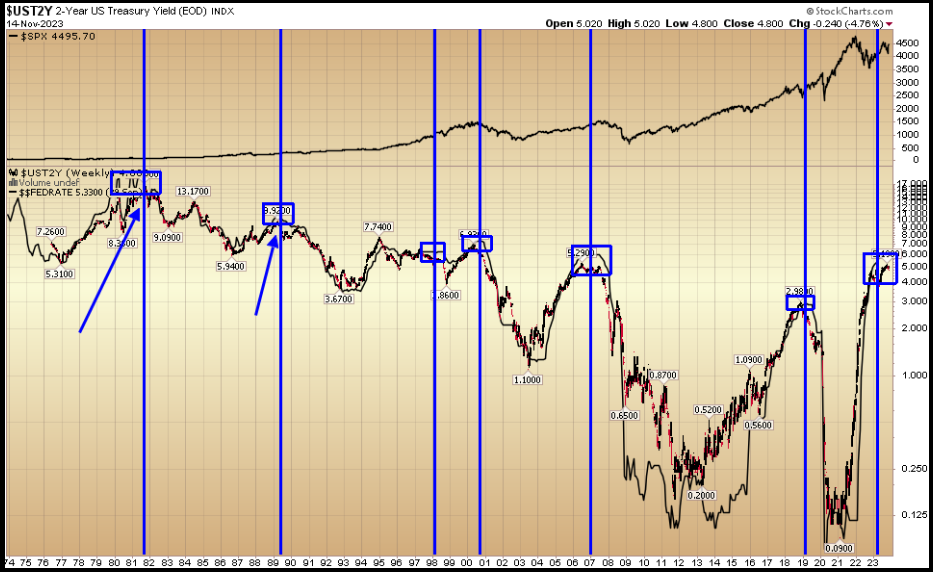
As you can see below, historically when the two year yield (in red/black) trades below the Fed Funds Rate (in solid black), the two year yield wins. That means, the Fed is forced to cut – as they are too restrictive and destroying the economy.
Most market participants suffer from “recency bias” and will look at the most recent few events to confirm that cuts will mean bad things for the market and economy. However, if you look back a bit further you will see in 1982 (early cycle) and 1989 (mid cycle) this (cuts) was executed with no deleterious effects to the markets or economy. Just the opposite, it was an accelerant to get things going:
Now onto the shorter term view for the General Market:
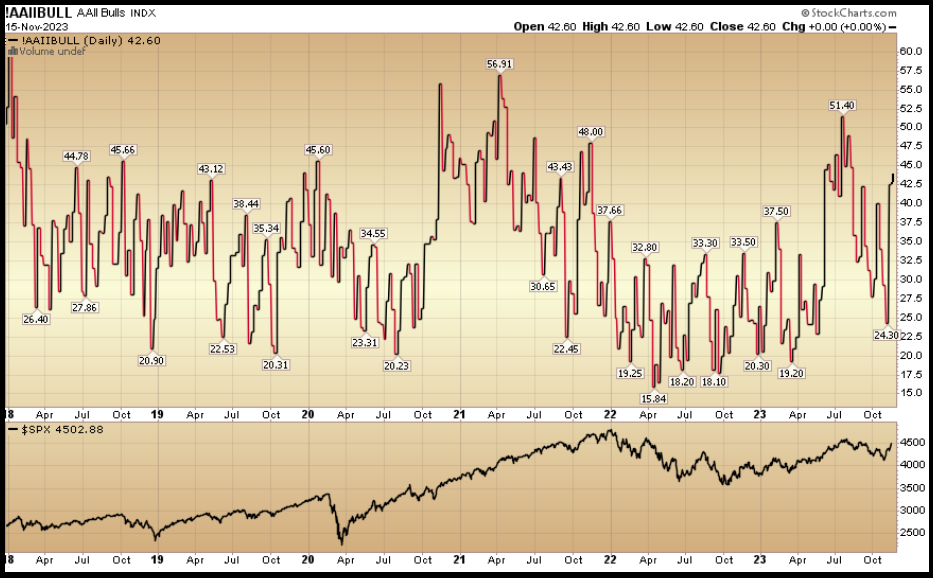
In this week’s AAII Sentiment Survey result, Bullish Percent (Video Explanation) ticked up to 43.8% from 42.6% the previous week. Bearish Percent also ticked up to 28.1% from 27.2%. Retail investors are starting to get giddy. This level can stay elevated during major moves (see below), but be open minded to a little give-back in markets (in the short term) to knock the certainty out of their mind before moving higher.
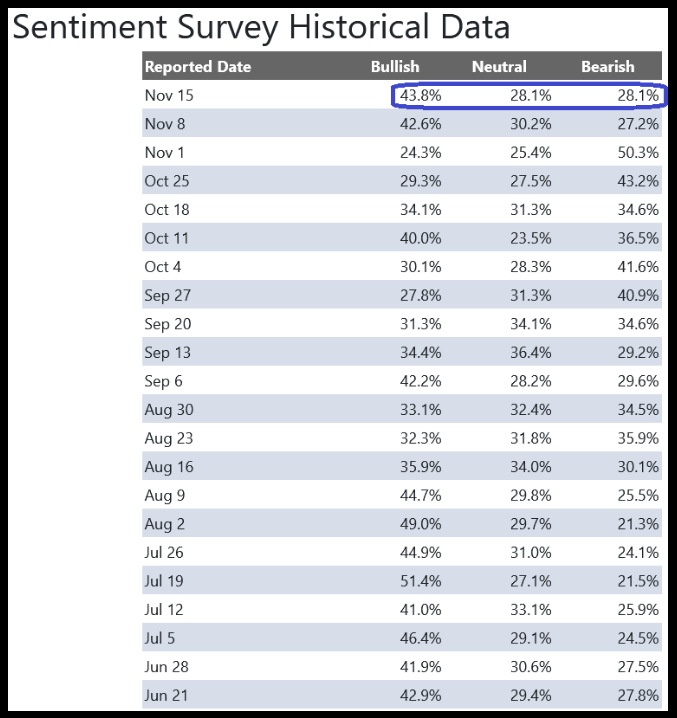 Sentiment Survey Historical Data
The CNN “Fear and Greed” moved up from 40 last week to 53 this week. Investors are neutral. You can learn how this indicator is calculated and how it works here: (Video Explanation)
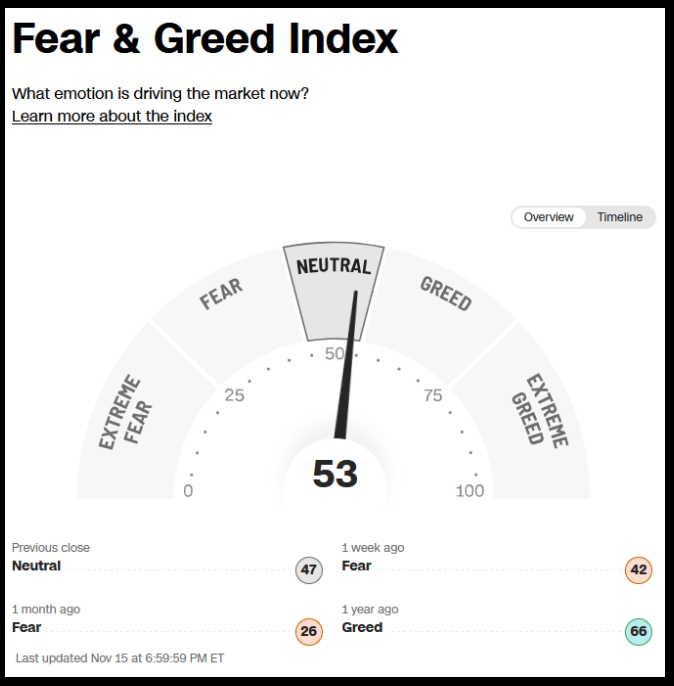
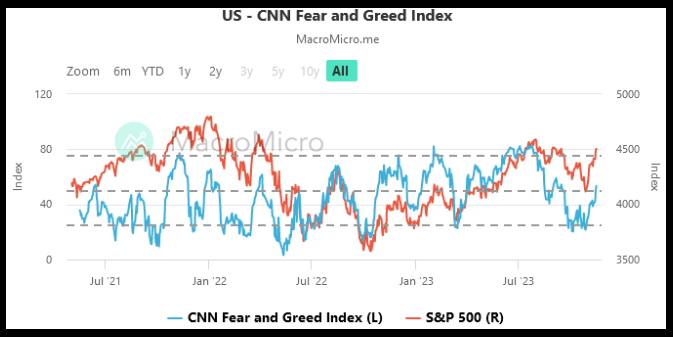 UN – CNN Fear and Greed Index
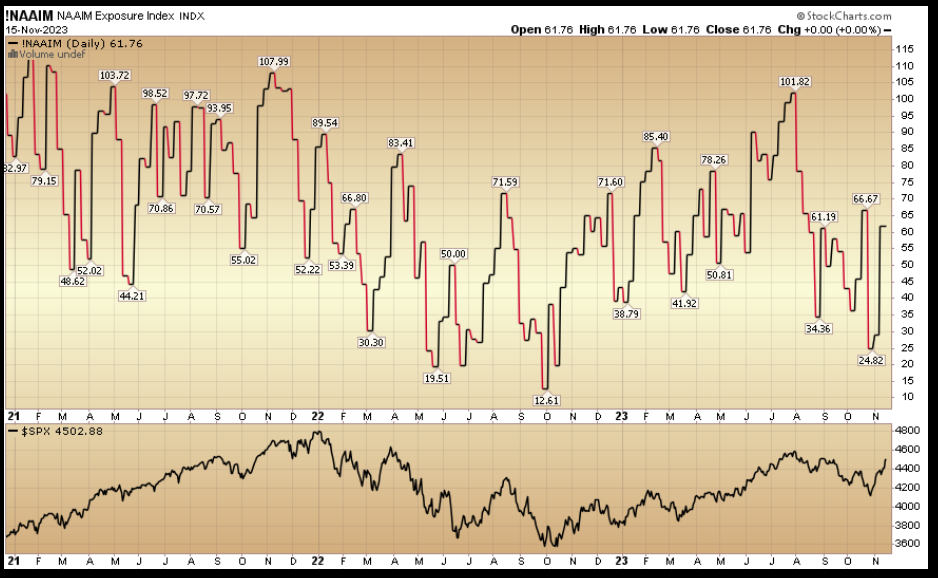
And finally, the NAAIM (National Association of Active Investment Managers Index) (Video Explanation) moved up to 61.75% this week from 29.17% equity exposure last week. The year end chase is going to continue in coming weeks:
This content was originally published on Hedgefundtips.com.


