Natural Gas Ripe for a Rebound? Bounce to $2.5 Likely as Bulls Defend Key Support
2024.07.31 05:39
- Natural gas prices have been on a downward trend, but rising demand and tightening supply signal a rebound.
- Inventory levels are declining faster than expected, signaling a potential shift in the market.
- Technical indicators suggest a bullish outlook for natural gas prices, with a potential rebound targeting $2.5 on the horizon.
- Unlock AI-powered Stock Picks for Under $8/Month: Summer Sale Starts Now!
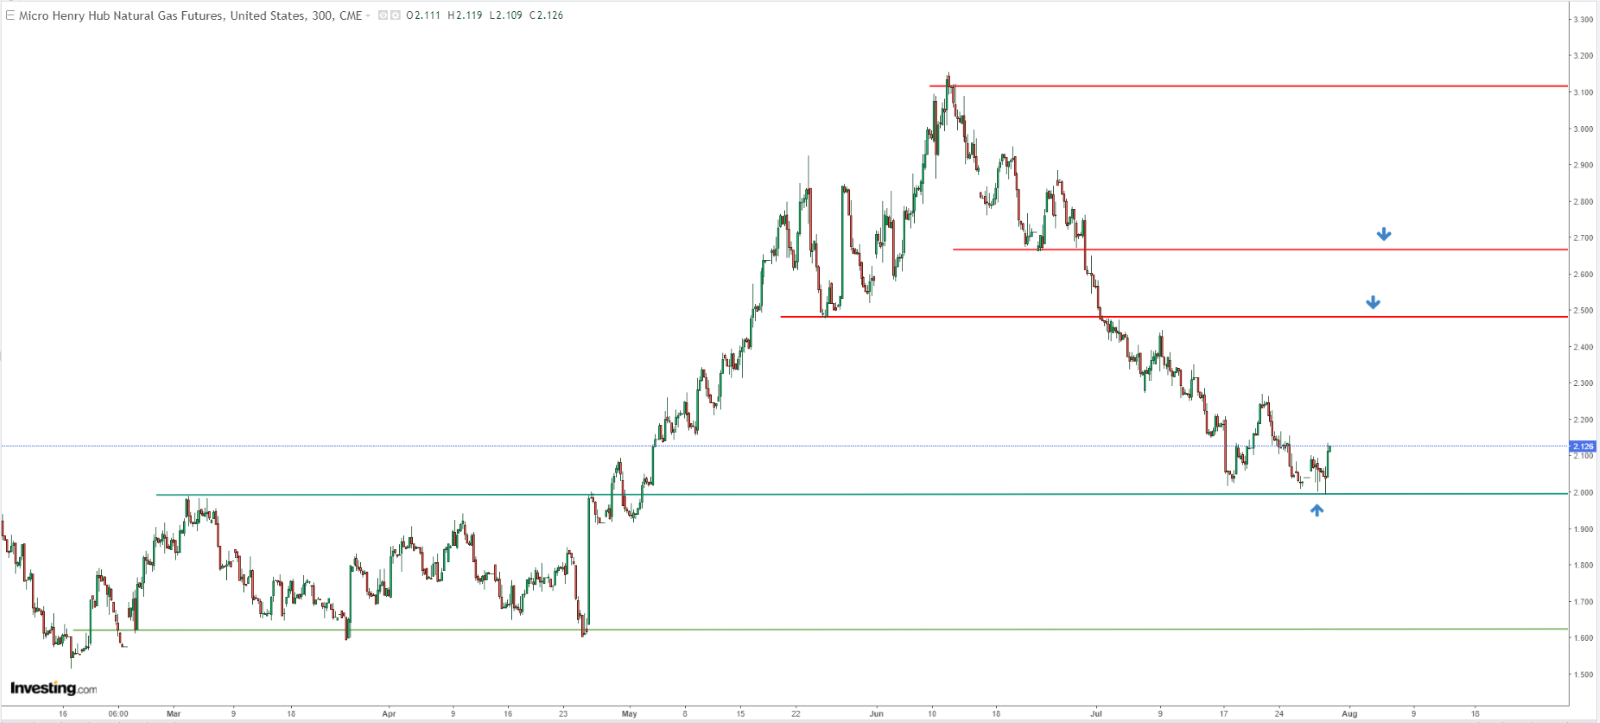
prices have been steadily declining for the past two months, dipping below the crucial $2 per mmBtu mark. High from a mild winter combined with robust production have outpaced current demand, driving prices lower.
However, this downward trend may soon end. A potential slowdown in the broader mining and exploration sector could curtail production, while record temperatures anticipated for August could boost consumption.
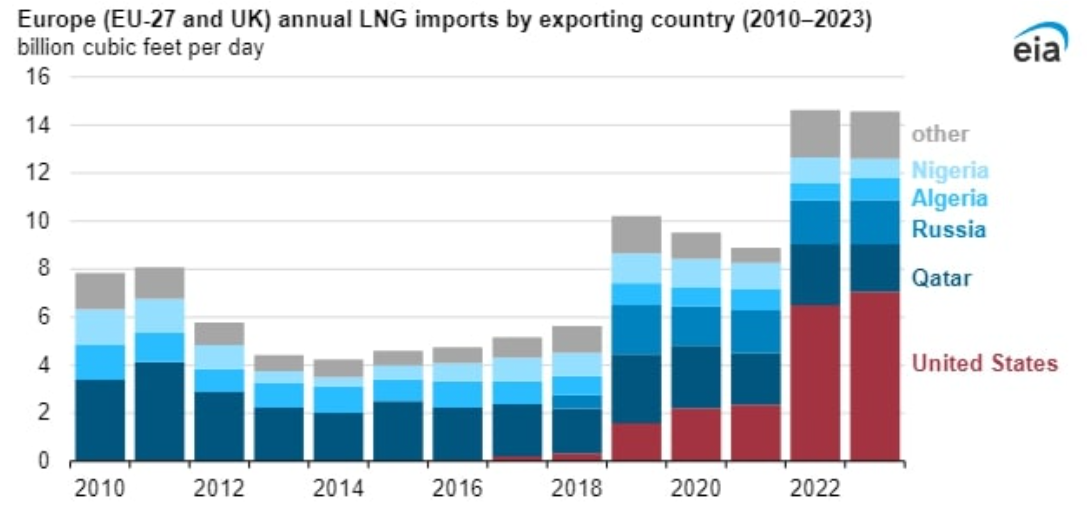
From an export perspective, US natural gas supplies to Asian and European markets are expected to increase by 2025 with the launch of new LNG terminals: Plaquemines LNG, Corpus Christi Phase 3, and Golden Pass. Currently, the US holds a dominant position, supplying 48% of LNG to Europe.

Inventories, Rising Demand Signal Potential Price Rise Ahead
A relatively warm winter has boosted inventory levels in US storage facilities, easing supply pressures throughout 2024. Currently, working stocks of natural gas stand at 3,231 Bcf, 16% higher than the five-year average.
However, the latest July data shows a decline in the rate of storage replenishment, at 22 Bcf, below last year’s figure of 23 Bcf and the five-year average of 31 Bcf.
Since April, a total of 950 Bcf has been injected into warehouses, also below the five-year average by 15%, indicating the waning effect of high inventories from the warm winter.
On the demand side, electricity production from natural gas has increased, reaching 6.9 million megawatt hours on July 9, the highest since detailed data monitoring began in 2019.
This spike is due to weaker wind energy production and high temperatures, key drivers of natural gas demand. With forecasts predicting August to be one of the warmest months on record, short-term demand pressure is likely to rise.
Considering these factors, an upward price scenario for natural gas is possible in the coming weeks, with a target of at least $2.5 per mmBtu.
Natural Gas Technical View: Rebound Ahead?
Henry Hub contract prices are forming a double-bottom pattern around the $2 mark, indicating a possible rebound. The first resistance level is at $2.5, followed by $2.7.

In a more bullish scenario, prices could test and correct June peaks, potentially challenging this year’s highs around $3.40. Conversely, a drop below $2 would negate this upward trend and could lead to testing long-term lows below $1.6 per mmBtu.
***
This summer, get exclusive discounts on our subscriptions, including annual plans for less than $8 a month!
Tired of watching the big players rake in profits while you’re left on the sidelines?
InvestingPro’s revolutionary AI tool, ProPicks, puts the power of Wall Street’s secret weapon – AI-powered stock selection – at YOUR fingertips!
Don’t miss this limited-time offer.
Subscribe to InvestingPro today and take your investing game to the next level!

Disclaimer: This article is written for informational purposes only; it does not constitute a solicitation, offer, advice, counsel or recommendation to invest as such it is not intended to incentivize the purchase of assets in any way. I would like to remind you that any type of asset, is evaluated from multiple perspectives and is highly risky and therefore, any investment decision and the associated risk remains with the investor.


