Natural Gas: Near-Term Bearishness Could Persist With $3.70 Support Under Threat
2025.01.22 04:46
- Shifting weather patterns, EIA projections signal a challenging short-term outlook for natural gas.
- Global demand and the energy transition highlight a bullish case for the years ahead.
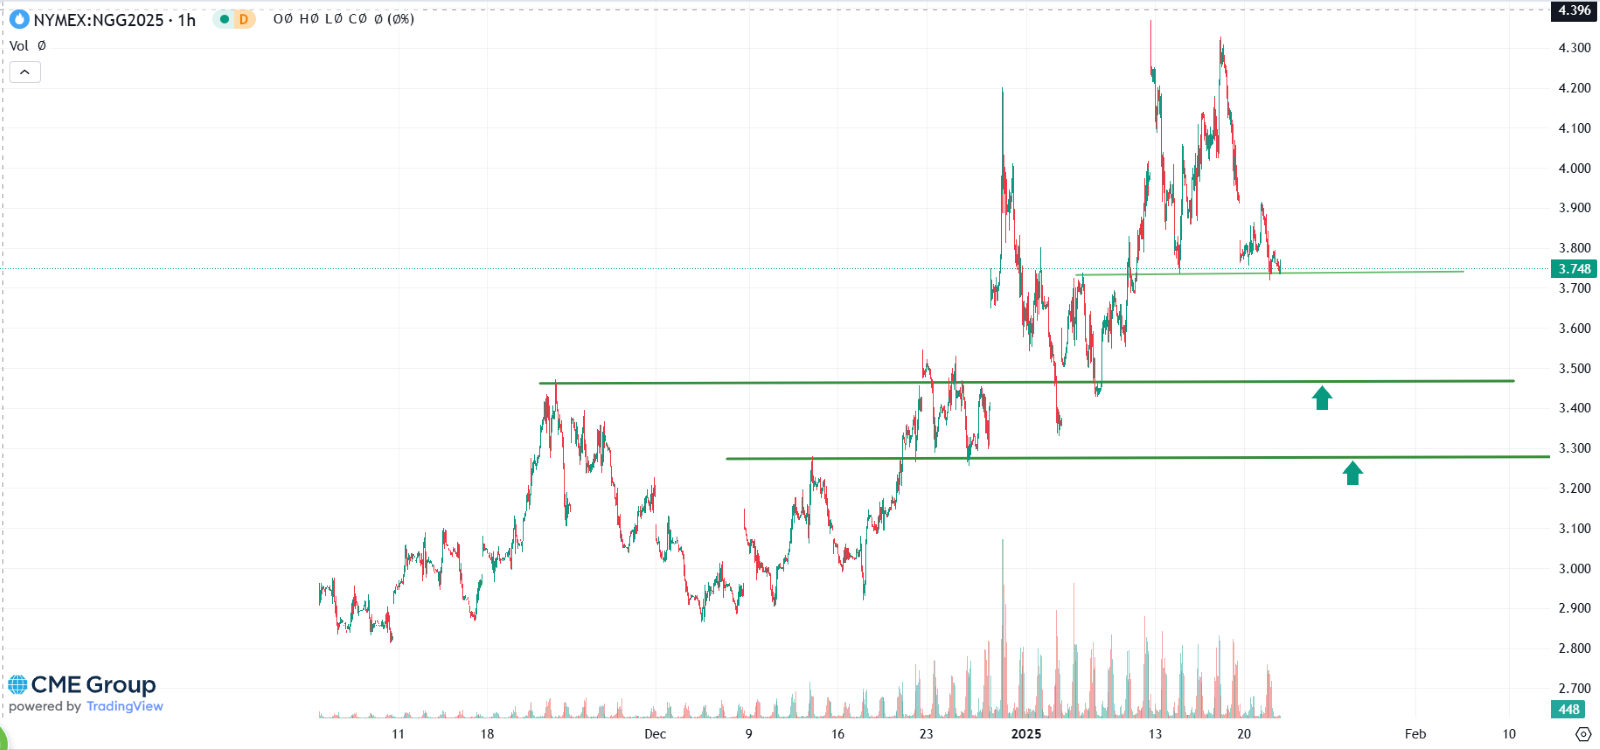
- Key support levels near $3.70 could determine if the current correction deepens or stabilizes.
- Kick off the new year with a portfolio built for volatility – subscribe now during our New Year’s Sale and get up to 50% off on InvestingPro!
‘ uptrend has bit a roadblock with prices slipping into correction mode. This downturn stems from several factors, including the U.S. Energy Information Administration’s (EIA) forecast of lower average prices this year compared to current levels. Adding to the bearish sentiment, updated weather models now predict milder temperatures over the next two weeks, reducing heating demand and bolstering sellers’ positions.
While short-term conditions appear unfavorable, the long-term outlook paints a different picture. Structural imbalances between demand and supply, fueled by natural gas’s role as a key transition fuel in the global energy shift, could push average prices higher in the coming years. However, uncertainty lingers around energy policies under President Donald Trump, who has repeatedly emphasized boosting production of natural gas and oil.
EIA Forecasts Long-Term Gains for Natural Gas Prices
The EIA’s latest forecasts suggest natural gas prices may climb in the years ahead, despite current softness. Key updates include:
- Q1 2025: $3.21 per MMBtu, up from $2.91 in December.
- 2025: $3.14 per MMBtu, compared to $2.95 previously.
- 2026: $3.97 per MMBtu.
The agency attributes this optimism to growing demand, expected to outpace supply growth significantly in the U.S. (3.2 billion MMBtu vs. 1.4 billion MMBtu). Adding fuel to the fire, Asian markets have ramped up imports, and Europe remains reliant on U.S. natural gas as it pivots away from Russian supplies.
Storage Trends Add a Layer of Complexity
data offers mixed signals for traders. While crude in most U.S. states are 6% above average levels, year-over-year comparisons reveal a modest 3% decline. With the heating season still active, near-term price movements will largely hinge on temperature swings. However, if current trends persist, prices could dip below the critical $3 per MMBtu mark.
Natural Gas: Technical View
Henry Hub natural gas contracts have tested resistance just shy of $4.40 per MMBtu, suggesting this could mark the year’s peak. The recent correction has stalled near the $3.70 per MMBtu support level, a critical threshold for traders to watch.

Should sellers push prices below this support, the next targets lie at $3.50 and $3.30 per MMBtu, potentially deepening the bearish trajectory.
***
Wondering how the world’s top investors are gearing up their portfolios for the year ahead?
Discover their strategies with InvestingPro.
Take advantage of our New Year’s offer—your last chance to get InvestingPro at 50% off!

Disclaimer: This article is written for informational purposes only. It is not intended to encourage the purchase of assets in any way, nor does it constitute a solicitation, offer, recommendation or suggestion to invest. I would like to remind you that all assets are evaluated from multiple perspectives and are highly risky, so any investment decision and the associated risk belongs to the investor. We also do not provide any investment advisory services.


