Market at Frothy Highs? These Strategies Can Help You Create Wealth Starting Now
2024.06.07 08:08
- Investing doesn’t have to be daunting if you focus on realistic strategies and asset allocation.
- Understanding your goals, circumstances, and risk tolerance is key to creating a balanced portfolio.
- As the market reaches new highs, maintaining a disciplined approach and paying attention to economic indicators can help navigate potential volatility.
- Invest like the big funds for under $9/month with our AI-powered ProPicks stock selection tool. Learn more here>>
Earning money may seem like a daunting task, but it doesn’t have to be. Forget the get-rich-quick schemes – let’s focus on realistic and achievable strategies.
With all the talk about artificial intelligence and its impact on various sectors, like electric vehicles, you might be wondering: how should I invest in June 2024? How much should I put into stocks, and which sectors?
The answer depends on you. The key is to create an asset allocation that matches your risk tolerance and investment timeline.
While we all want to grow our portfolios, a healthy risk profile considers three key factors:
- Your Goals: Are you saving for retirement, a down payment on a house, or a child’s education? Different goals have different time horizons, which influence investment decisions.
- Your Circumstances: How much income do you have? What’s your current portfolio size? These factors determine how much risk you can afford to take.
- Your Risk Tolerance: How comfortable are you with potential losses? This is the emotional core of any investment plan.
Remember, there’s no one-size-fits-all asset allocation. A common approach is a 60/40 split, with 60% in stocks and 40% in bonds. But a 50/50 or 75/25 split might be more suitable depending on your circumstances.
The crucial point is to stick to your chosen allocation, even when markets get rough. Don’t get caught up in chasing the “hot” sectors or trying to time the market.
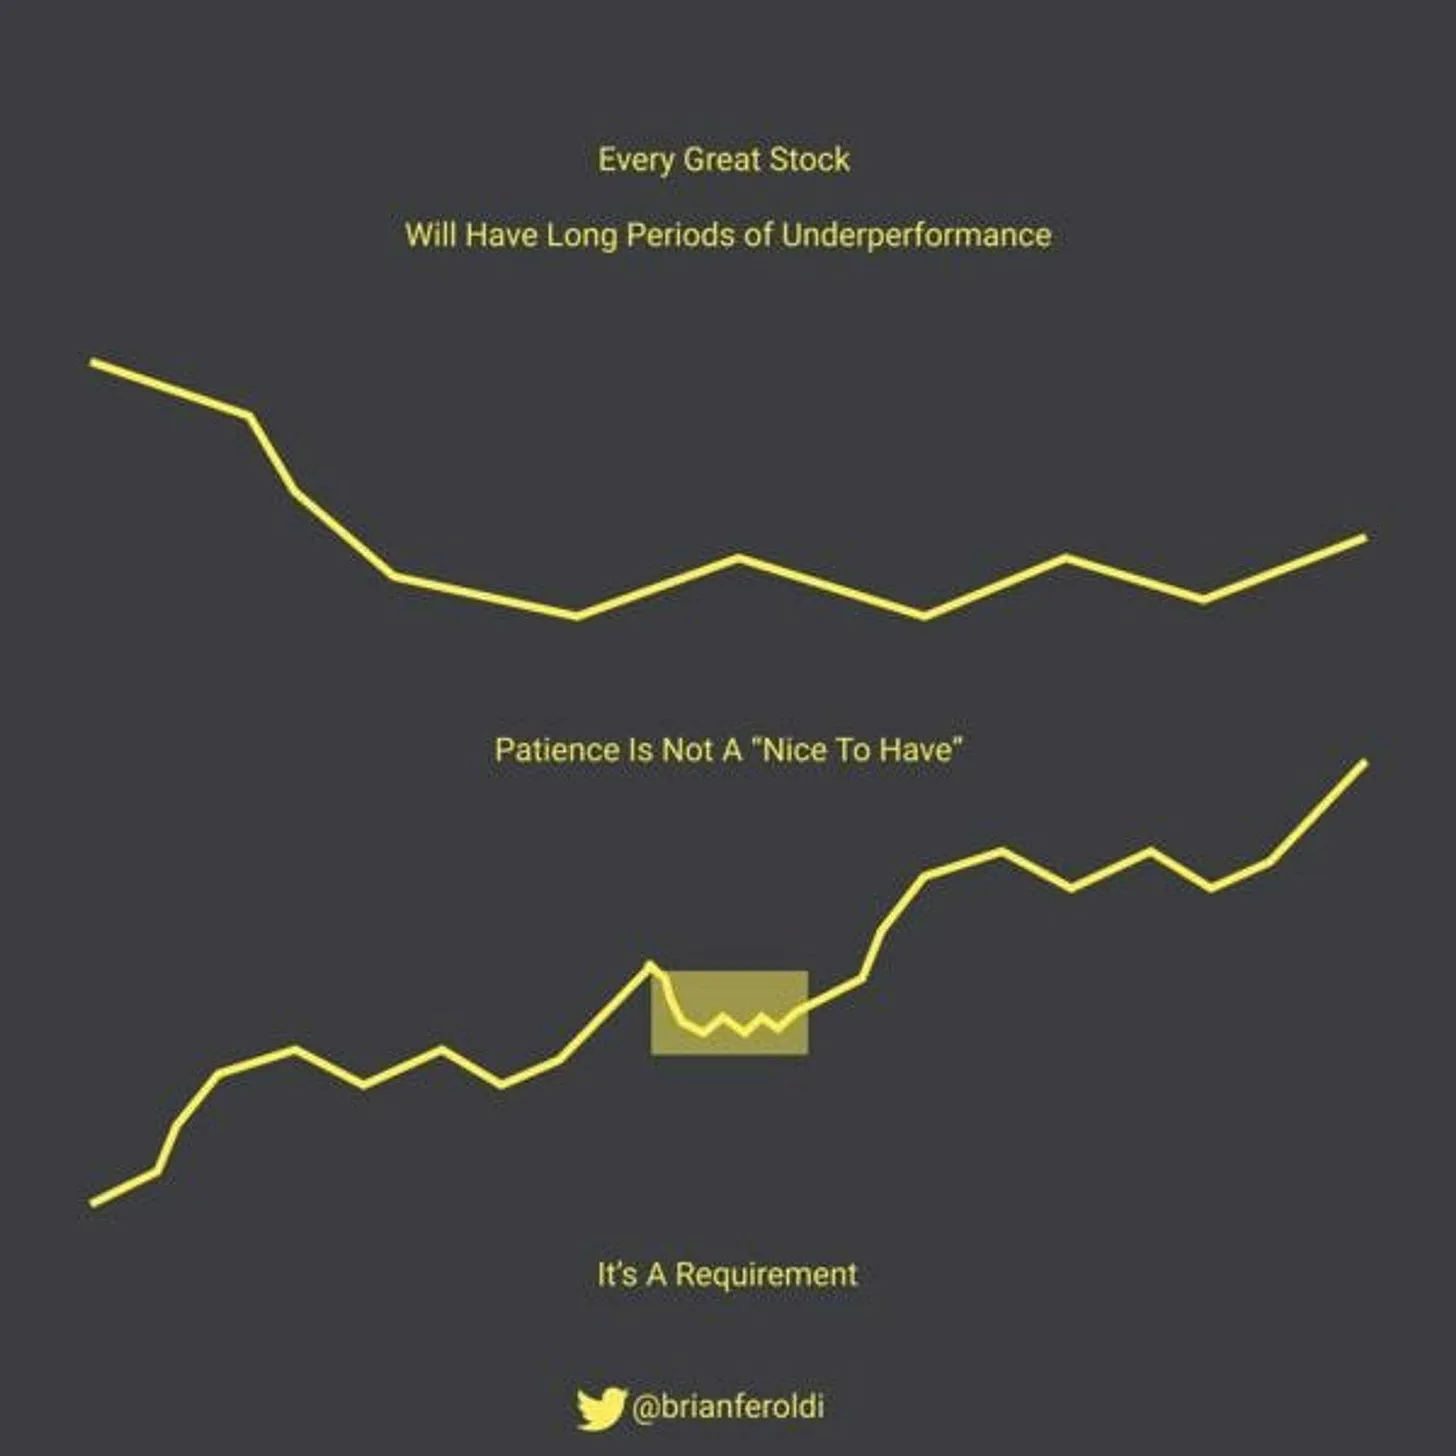
The Power of Patience
The best investment returns come from staying calm and disciplined. Don’t obsess over your investments every day.
Building wealth is a marathon, not a sprint. The key is to find an asset allocation that balances your risk tolerance with your long-term goals. Studies show that millionaires often attribute their success to consistent investments over a long period.
 Source: Brian Feroldi
Here’s the secret weapon: compound interest. Albert Einstein called it the “eighth wonder of the world,” and Warren Buffet agrees. It allows your money to grow exponentially over time.
Investing requires patience. Resist the urge to make impulsive decisions based on market fluctuations. Remember, patience and a long-term perspective are key ingredients for successful investing.
How Should You Invest Now, Considering the Overstretched Bull Run?
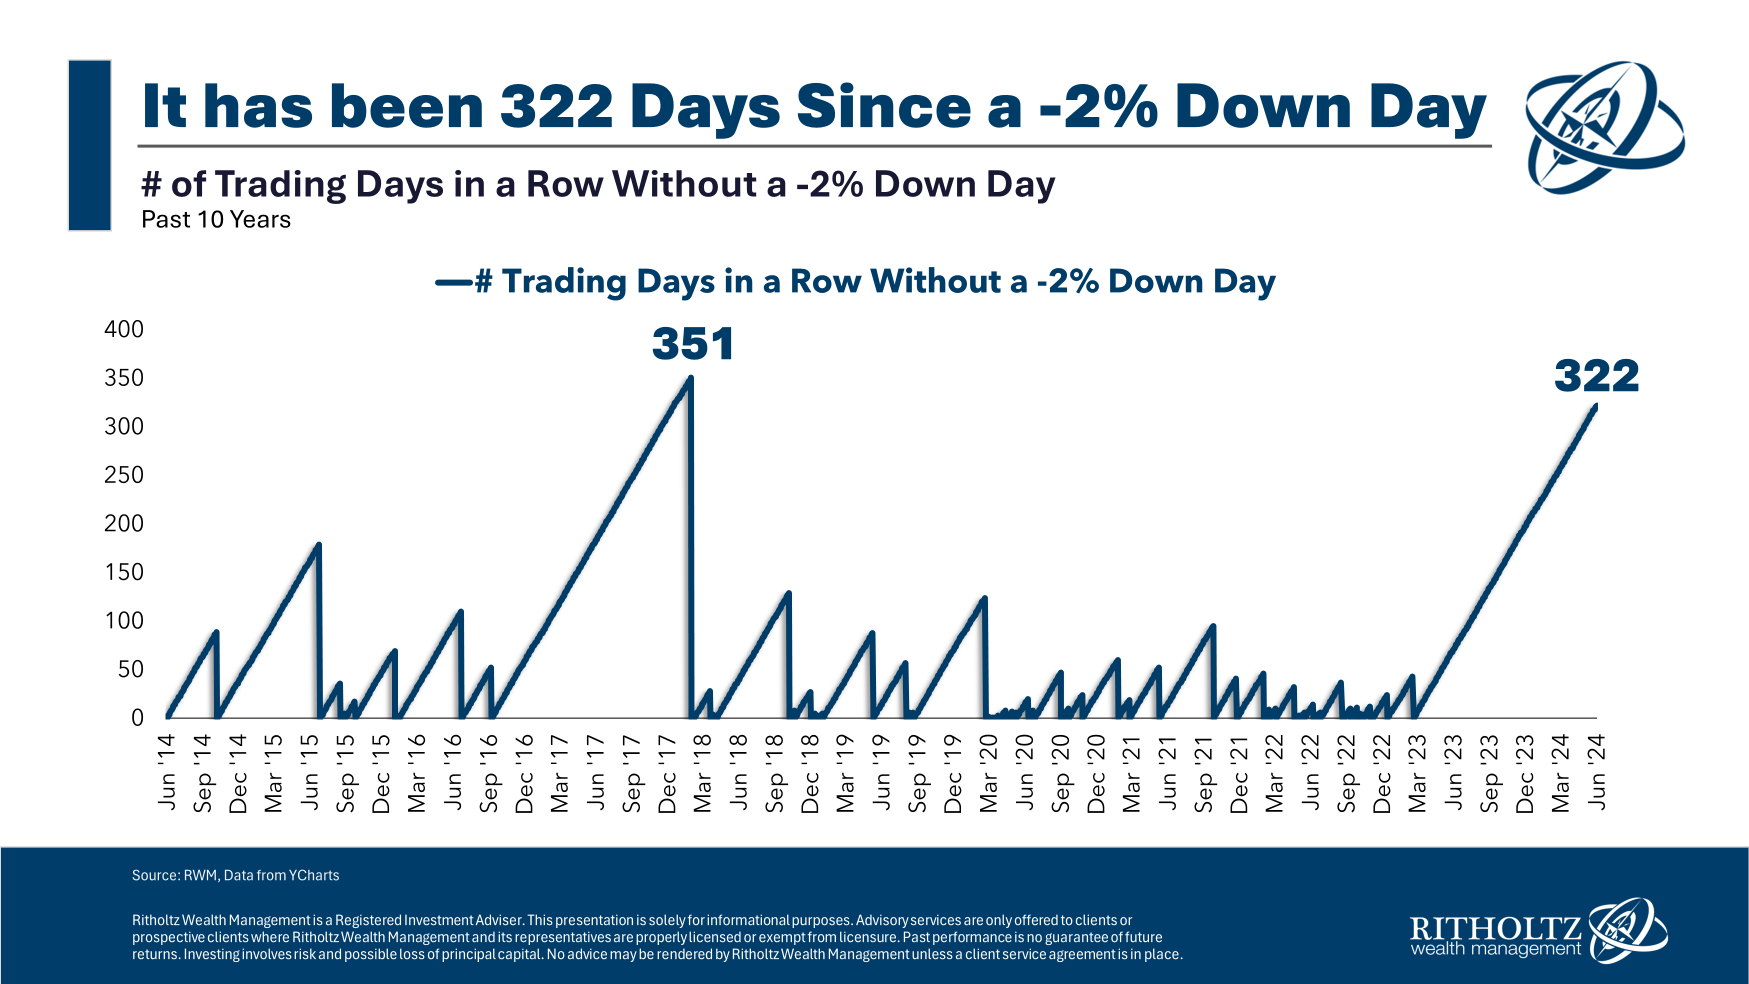
The has been rallying this year. We’ve seen 24 record highs in 2024 alone, volatility is low, and there haven’t been any major dips in over 300 trading sessions. This bullish run has pushed the index closer to its longest streak in a decade.

With the S&P 500 up over 12% year-to-date, following a stellar 2023 with a 26% return, these are undeniably good times for investors who stuck with their equity allocation, even through the rough patch of 2022.
But here’s the reality check: this party won’t last forever. Economist Hyman Minsky’s “Financial Instability Hypothesis” reminds us that prolonged prosperity can breed instability. In simpler terms, calm markets eventually turn choppy because, well, markets are cyclical.
So, how do we navigate this as investors? The key is to avoid emotional investing. Don’t get swept up in the euphoria of the masses. While predicting the exact end of this bull run is impossible, we can still be smart market readers.
While predicting the future is impossible, focusing on leading economic indicators can offer some insights. These indicators provide early clues about the market’s direction, unlike lagging indicators that simply confirm what’s already happening.
The 10-2 Yield Curve: A Not-So-Reliable Recession Predictor?
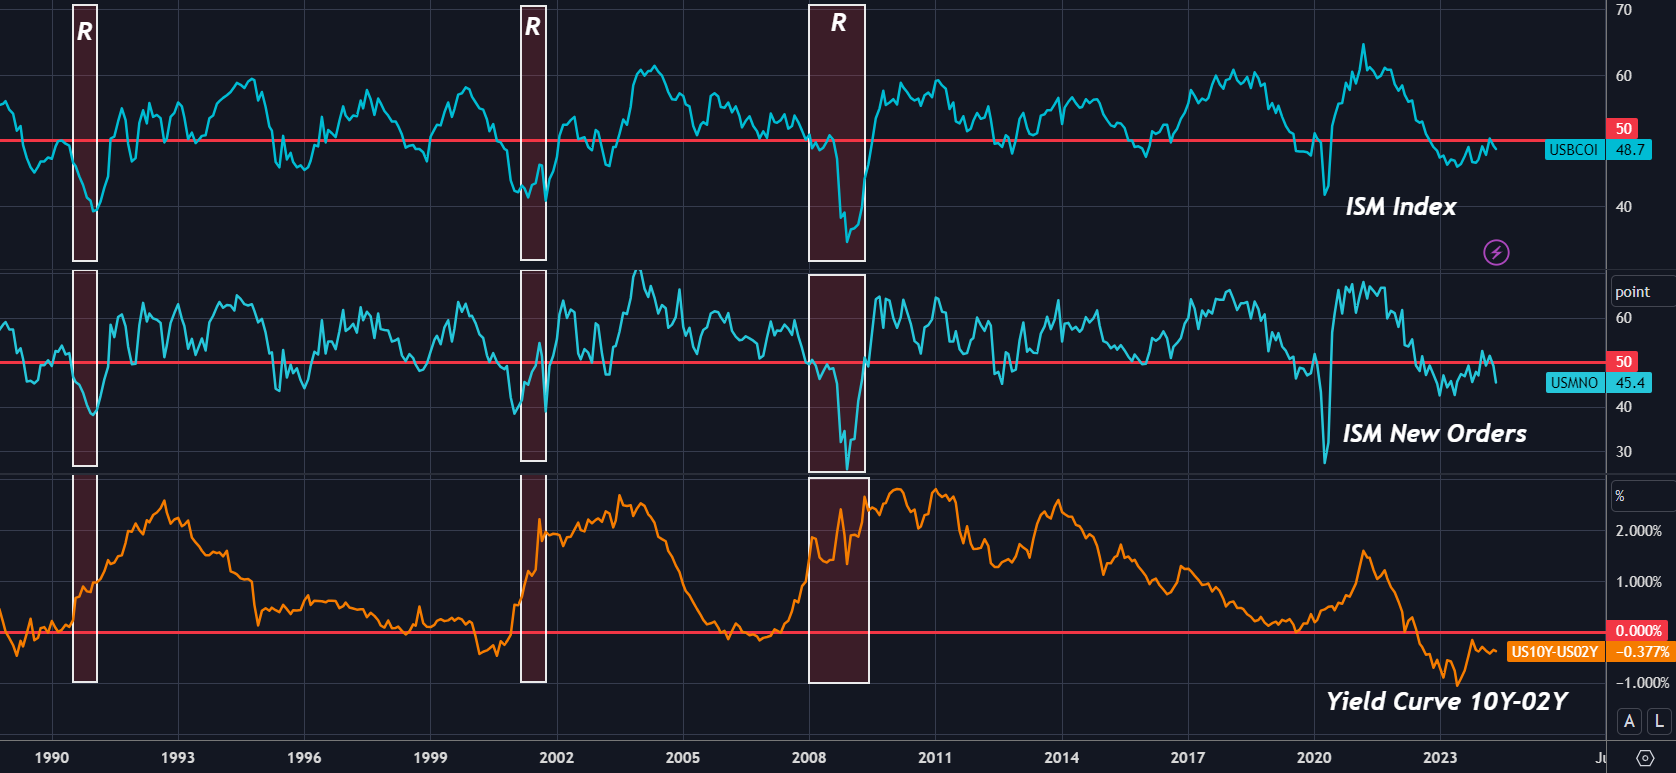
The infamous yield curve inversion has historically been associated with recessions. However, recent inversions haven’t necessarily led to an economic downturn. While the curve’s current position suggests we might be nearing a recession, the timing remains uncertain. Inversions can take 9 to 24 months to materialize into a recession.
We can add more economic indicators to strengthen our analysis. Let’s try and integrate the Index. This index incorporates variables like employment, new orders, production, and delivery times.
The latest June reading showed a decline of 0.5 percent from the previous month, falling from 49.2 points in April to 48.7 points. also fell by 3.7 percent in May, from 49.1 to 45.4 points, suggesting a potential contraction. 
Interestingly, although the inversion of the yield curve is usually interpreted as an impending recession, history since 1990 suggests a more nuanced view.
The real warning sign might appear when the inverted curves flatten (go close to zero), signifying similar yields on the short- and long-term maturities. This flattening is then often followed by a steepening (going above zero again).

Could this pattern, if accompanied by a drop in demand in the ISM manufacturing index and specifically in new orders, falling below the critical 50-point threshold as we’re seeing now, truly trigger a recession?
This combined signal from the yield curve and the ISM index could be a more accurate predictor of an economic downturn. However, it’s important to remember that economic data isn’t perfect, and further confirmation from other indicators might be needed.
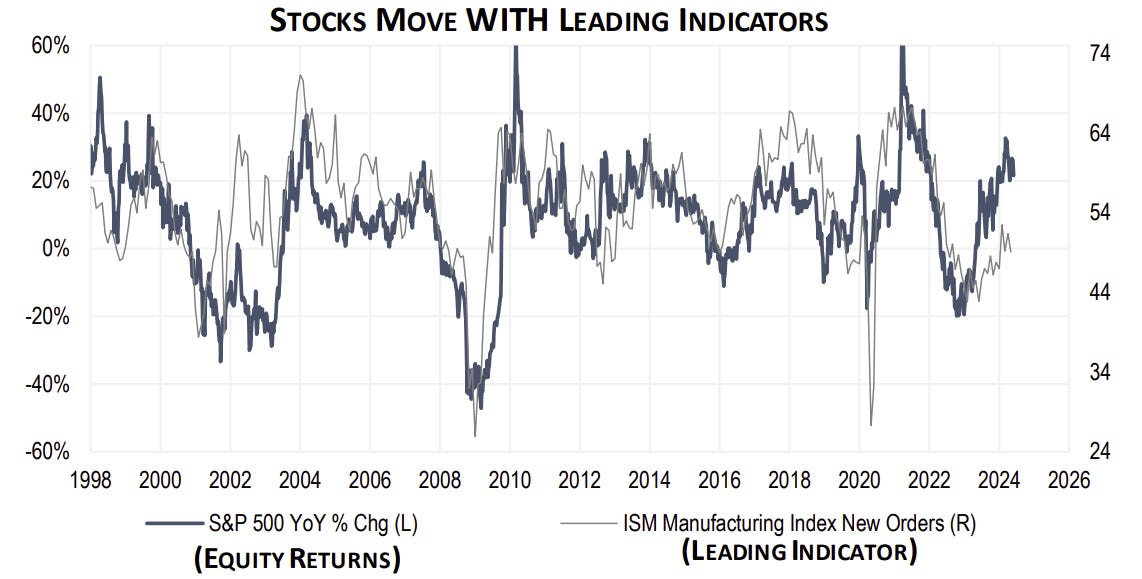
The chart above of the S&P 500 and the manufacturing PMI is a powerful example of how macroeconomics, like the yield curve and ISM index, can anticipate market trends and potentially foreshadow future returns.
While a guaranteed prediction of the bull market’s lifespan remains elusive, understanding these leading indicators can give you a significant edge over most investors.
***
Become a Pro: Sign up now! CLICK HERE to join the PRO Community with a significant discount.

Disclaimer: This article is written for informational purposes only; it does not constitute a solicitation, offer, advice, counseling or recommendation to invest as such it is not intended to incentivize the purchase of assets in any way. As a reminder, any type of asset, is evaluated from multiple points of view and is highly risky and therefore, any investment decision and the associated risk remains with the investor. The author owns shares in the company mentioned.


