“Inflation Relaxation” Stock Market (and Sentiment Results)…
2023.07.13 11:35
For many months we have been saying (in our weekly podcast|videocast) that June, July and August would be the months we would see headline inflation collapse to the mid to low 3% levels. This estimation was realized this week for the June numbers. We not only hit a “3 handle”, but were on the CUSP of a “2 handle!”
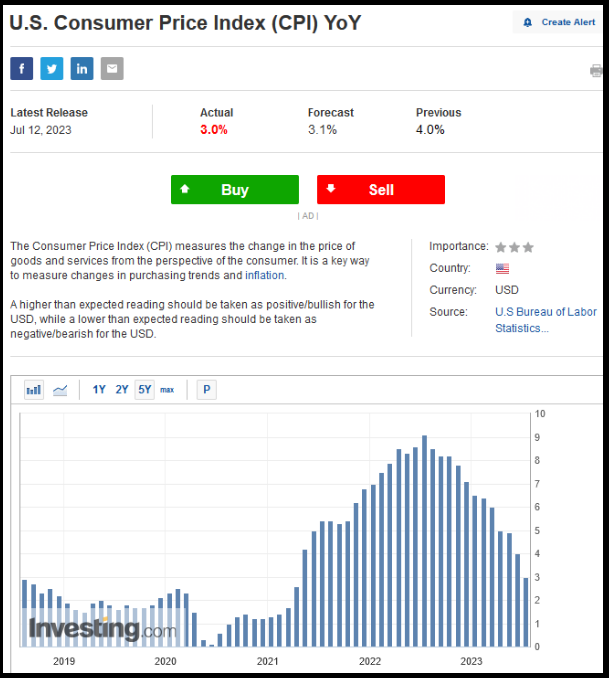
U.S. Consumer Price Index (CPI) YoY
On the back of the inflation print, The 10 year yield dropped along with the :
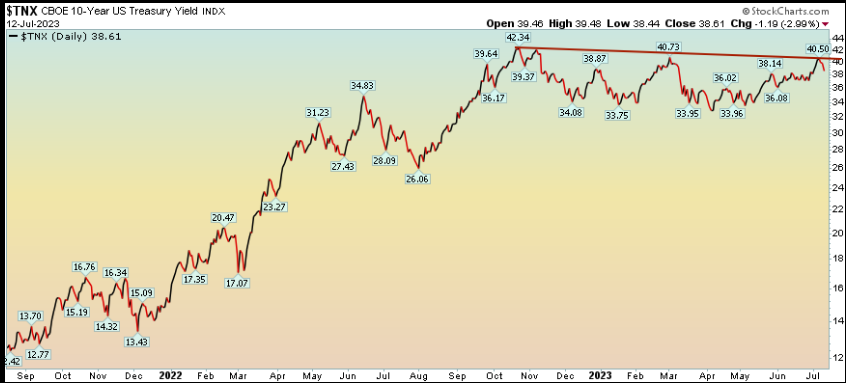 CBOE 10-Year US Treasury Yield
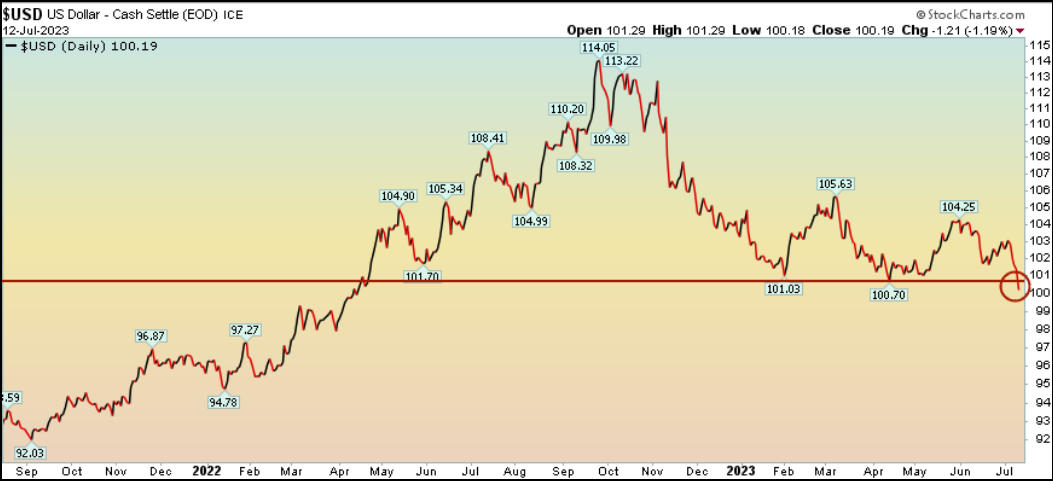
What didn’t drop is expectations of the Fed skipping a hike at the July meeting. This may change, but it has not moved yet:
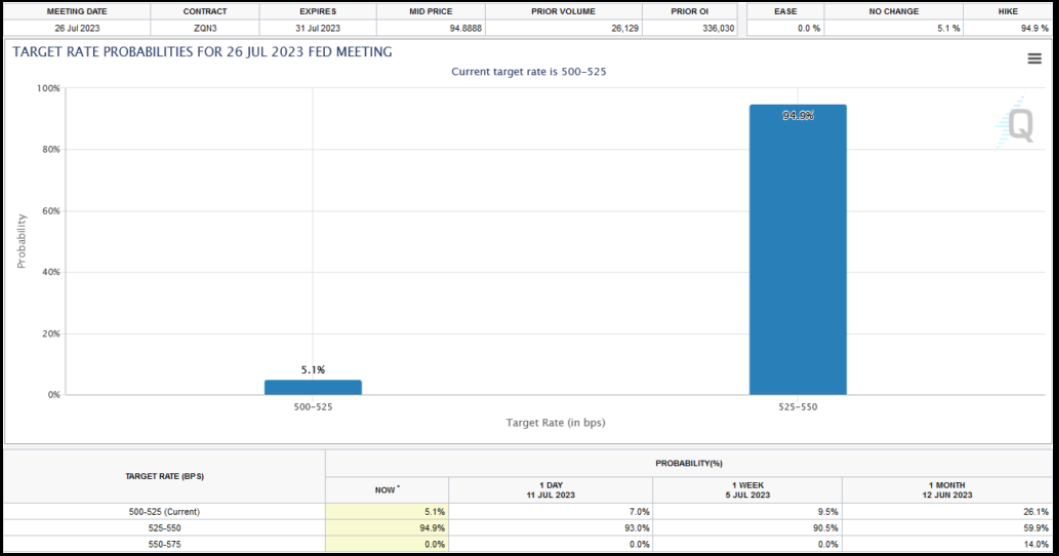 Target Rate Probabilities For 26 Jul 2023 FED Meeting
DUDLEY: “What I think this does do is open up the question of, will July be the last one, and that’s certainly possible.”
Between the jobs report on Friday and the inflation print this week, the Fed has MORE than enough cover to “skip” in July and wait for “more data.”
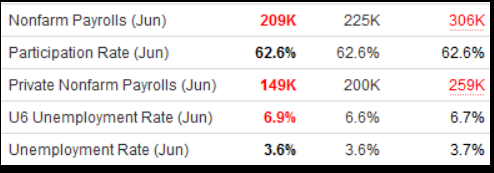
Data
Whether they will or not, remains to be seen. They are stuck in a 70’s framework that bears no resemblance to current conditions. The market has priced in this mistake, so it will not be terminal, but they are nearing the edge of pushing too hard if they go much further.
The “Sea Change” narrative we presented on June 1 is playing out in spades:
We are at the cusp of a sea change, and the knock on effects will be material. We expect to see two meaningful changes in coming months as a result of the Fed being done:
1) The Dollar will resume its downtrend after a “debt ceiling safe haven bid” in recent weeks.
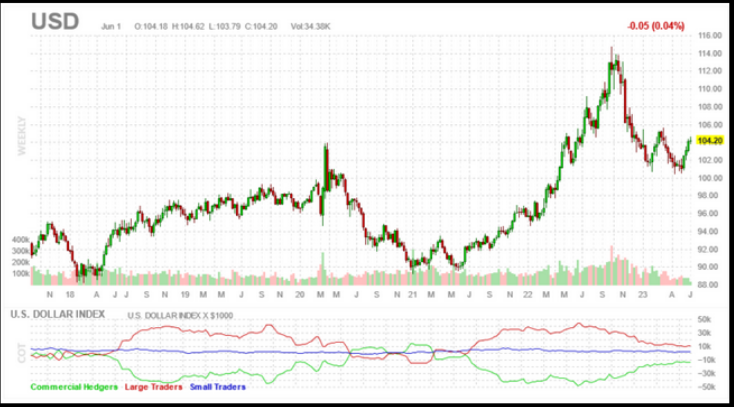
The most directly impacted asset classes from this development will be the groups that have been left behind in the recent rally:
a) Emerging Markets and China will resume the uptrend they began in October. China trades inversely with the USD and is the heaviest weighting in Emerging Markets Indices.
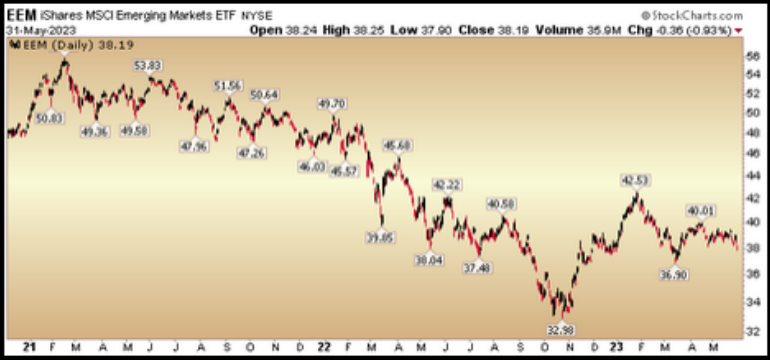 iShares MSCI Emerging Markets ETF
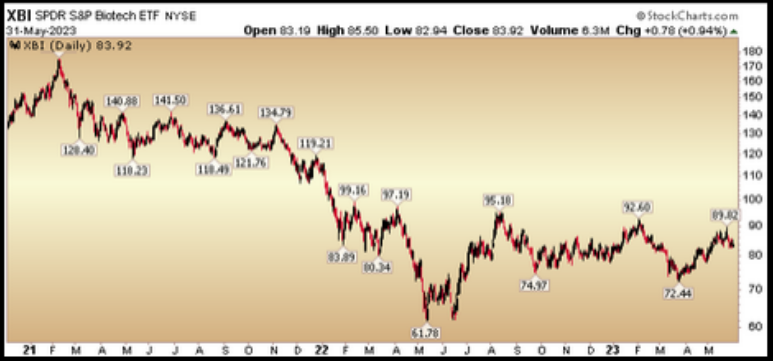
b) Biotech will accelerate its slow recovery from last May’s low as risk comes back into the market.
c) Any multi-national company with revenues abroad will increase earnings materially as the USD weekens. Roughly 40% of S&P 500 revenues are generated outside of the U.S. For example, Intel (NASDAQ:) gets – 82% of their revenues from outside U.S. 3M (NYSE:) gets – 49% of their revenues from outside U.S.
PayPal (NASDAQ:) gets – 47% of their revenues from outside U.S. VF Corp (NYSE:) gets – 45% of their revenues from outside U.S. Stanley Black and Decker (SWK) gets – 45% of their revenues from outside U.S. Baxter International (NYSE:) gets – 45% of their revenues from outside U.S.
2) Long Term Treasuries will begin to get bid after a few weeks of heavy issuance following the debt deal:
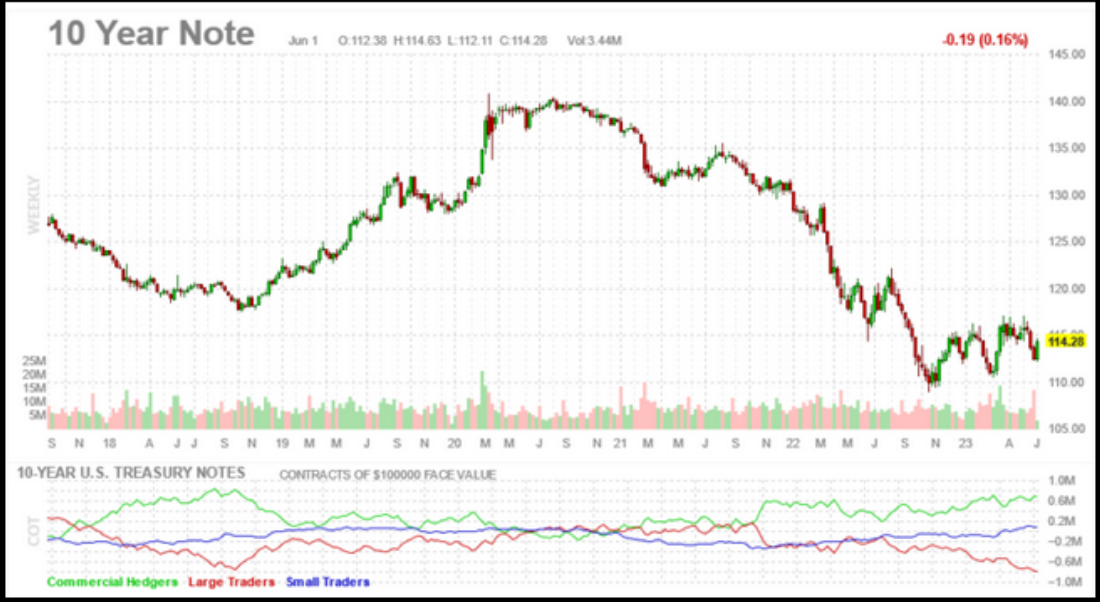
Interest rate sensitive sectors will get bid:
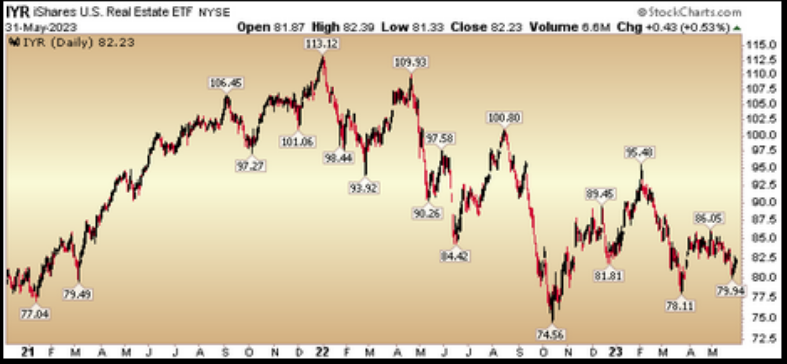
a) REITS have been left for dead. As the long end of the curve gets bid and rates come down, you will see this group begin to recover.
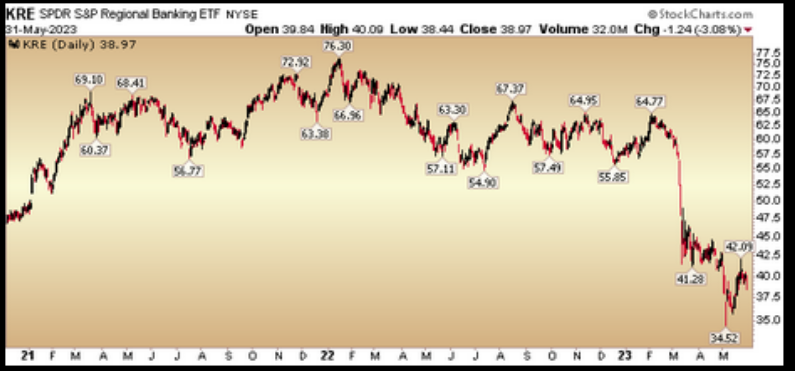
b) Banks will start to get bid again as their portfolio and loan book “mark-to-market” improves – reducing the need to raise capital. Funding costs will begin to moderate as deposite rates become more competitive to alternatives.
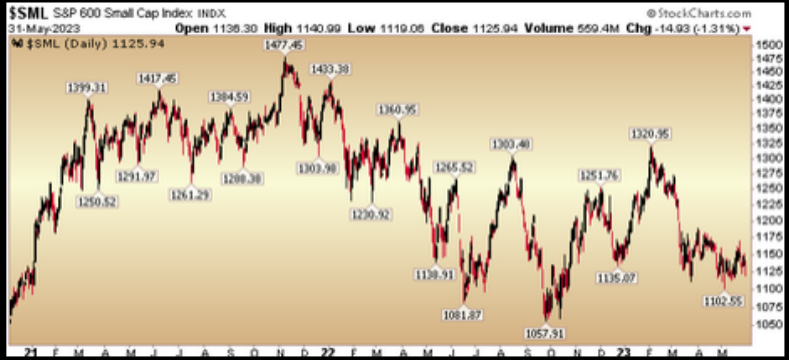
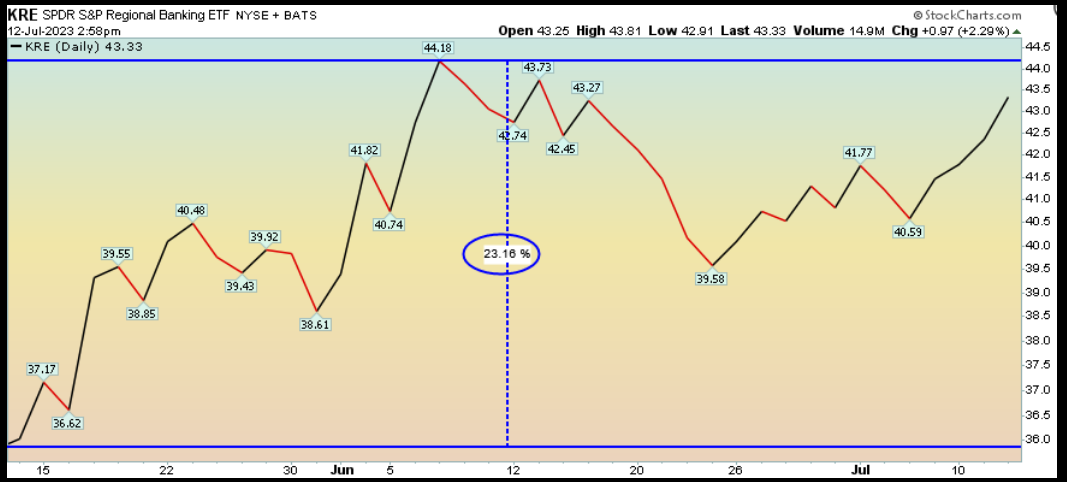
c) Small Caps will get bid as banks begin to recover. They have been a major laggard this year.
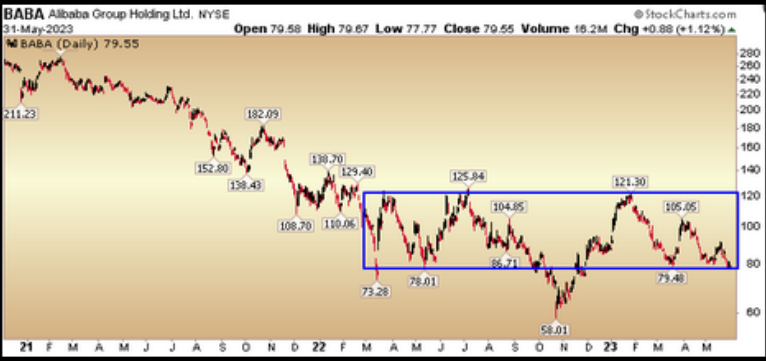
Alibaba (NYSE:) is up over 20%:
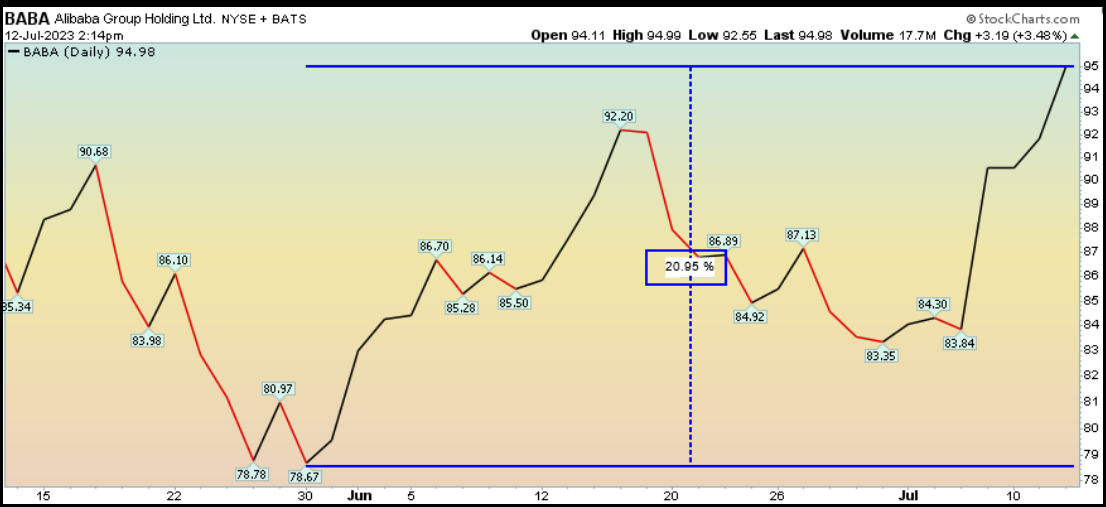 Alibaba Group Holding Ltd
Andy Jassy (CEO of Amazon (NASDAQ:)) was on CNBC this week laying out the bull case for Chinese Cloud providers like Alibaba (#1 market share). He debunked several bearish myths about the sector in less than 2 minutes:
7/11/2023 Bloombeg (key point on Politboro meeting – end of July):
Multi-nationals we pointed out (like INTC and MMM) in our June 1 article are making strong progress. Commentators/analysts are beginning to show support (“opinion follows trend”):
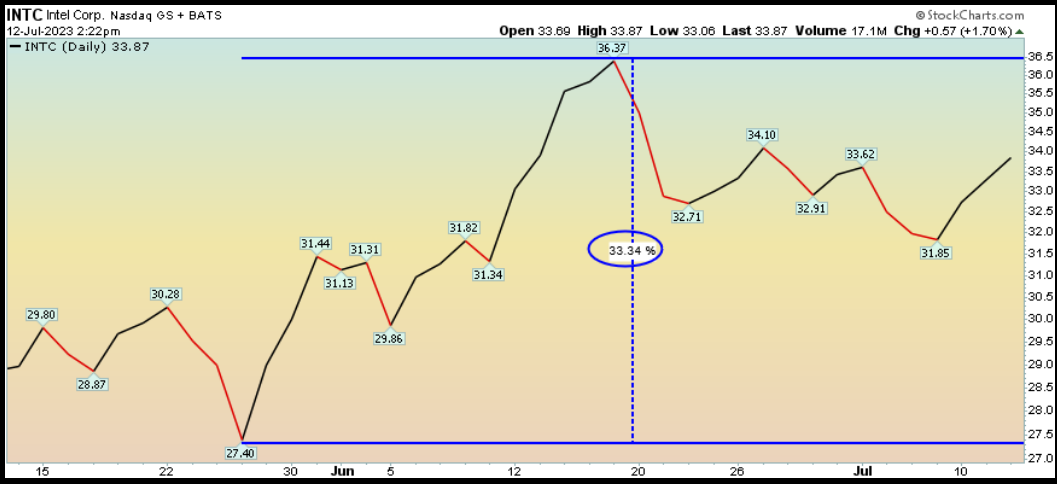
Jim Cramer 7/11/23 (INTC):
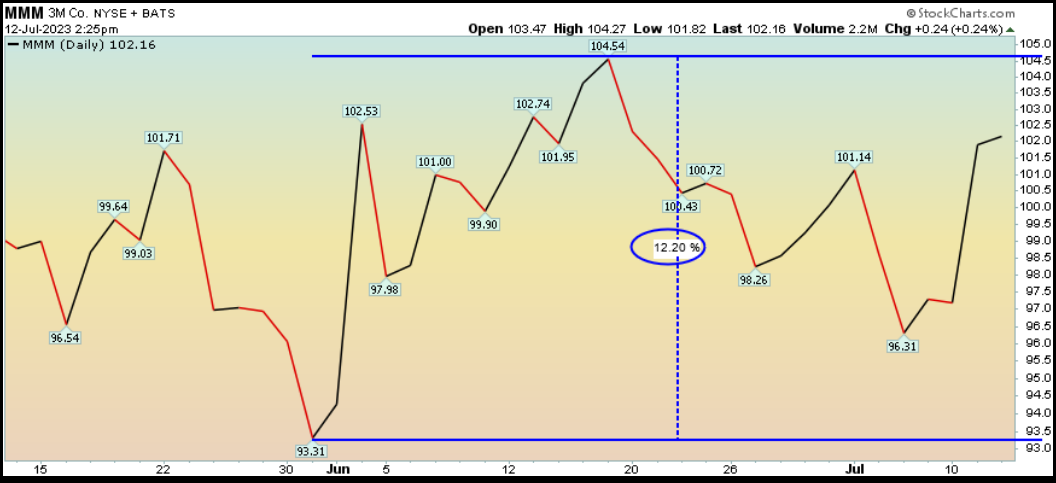
Stephanie Link 7/12/23 (MMM):
BofA upgrade 7/11/2023:
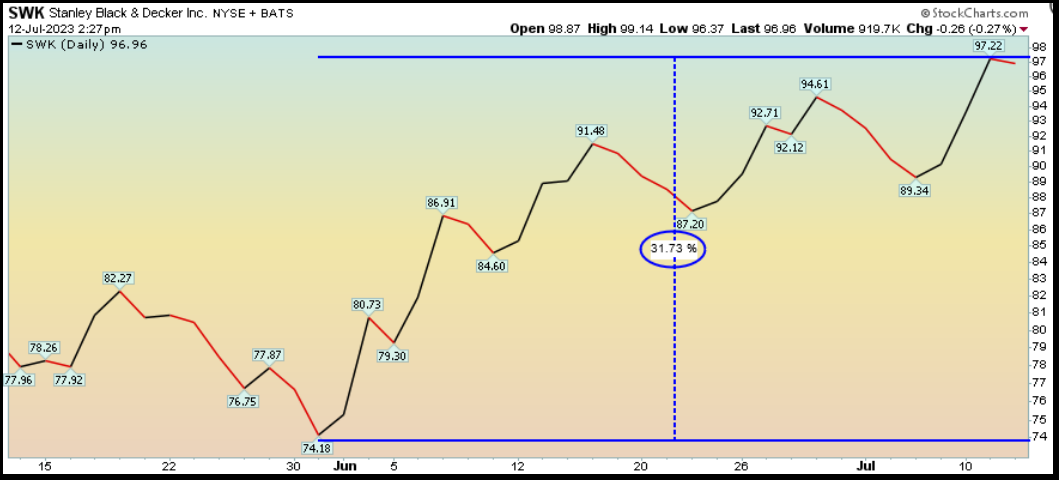 Stanley Black & Decker Inc
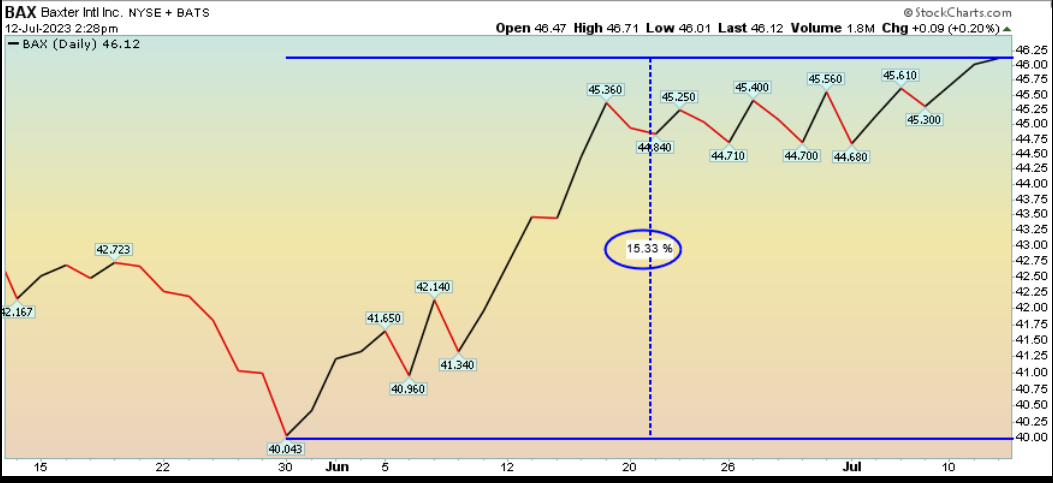
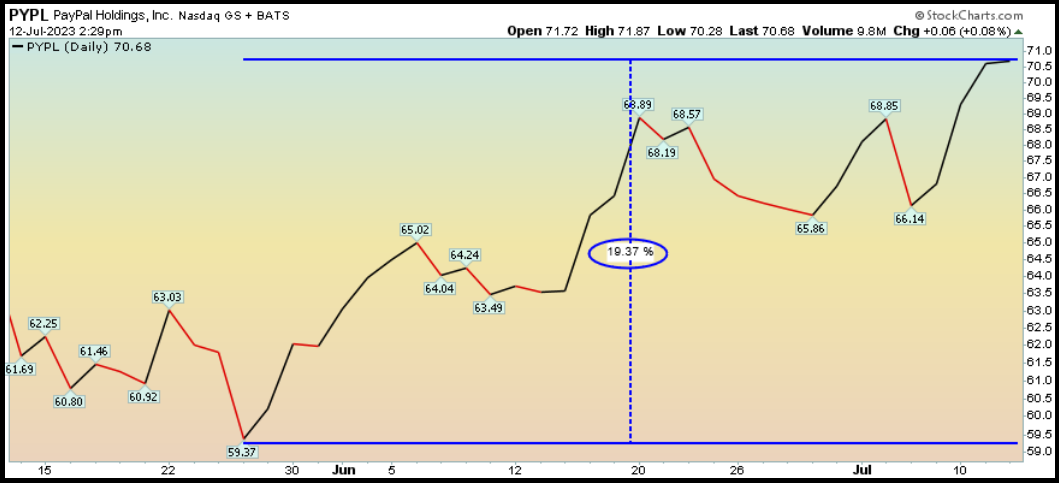
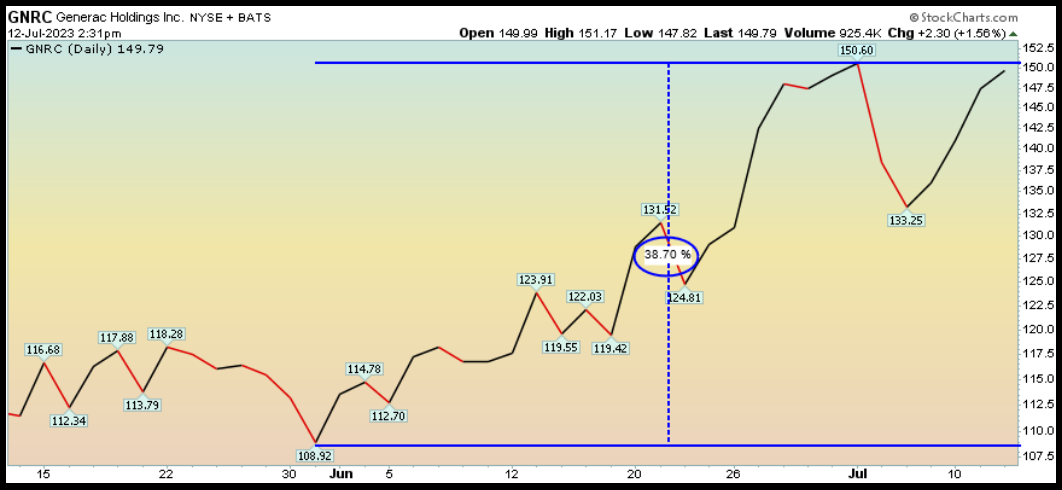
From June 15 (GNRC, PYPL):
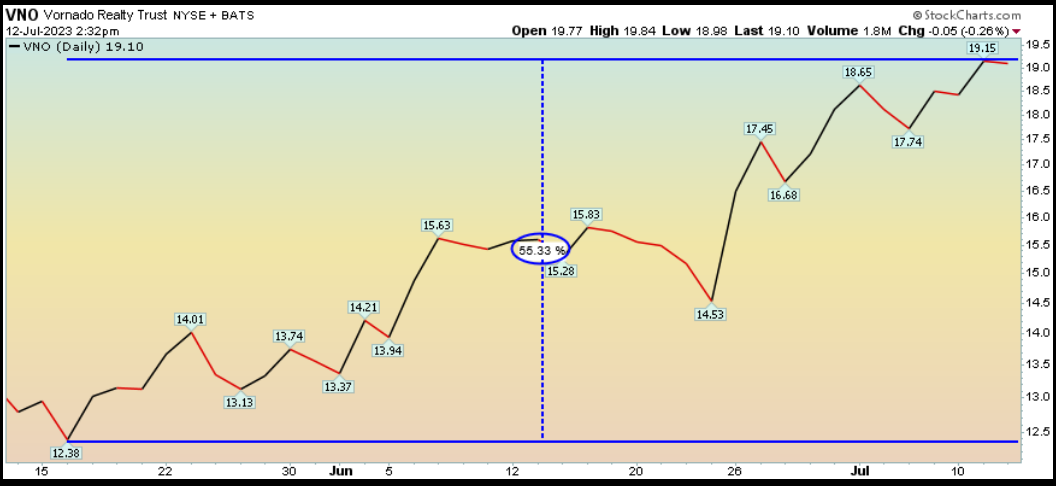
From April 20 (VNO):
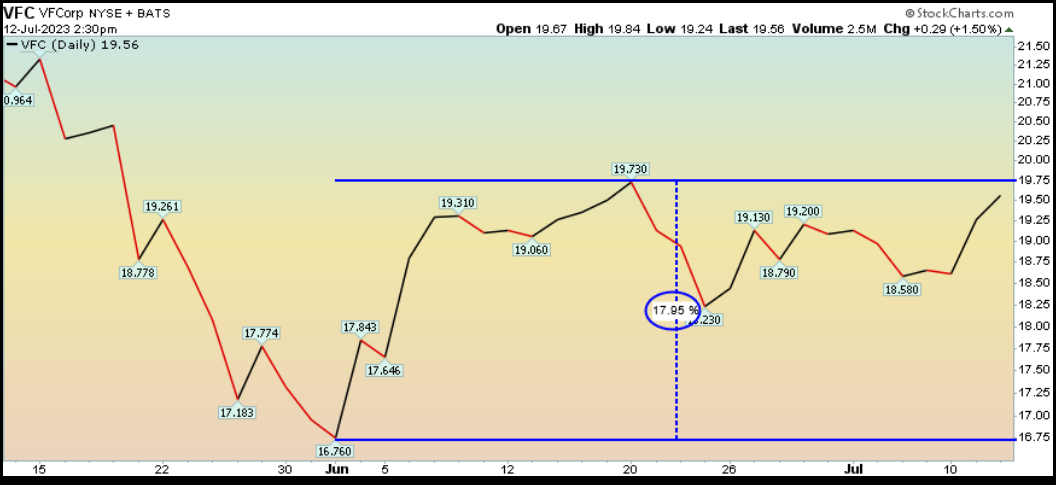
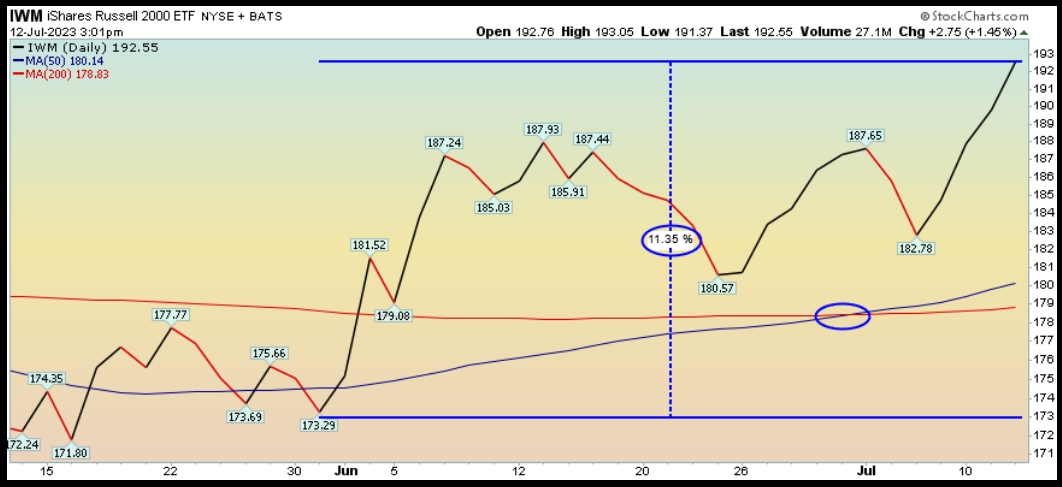
Small Caps even hit a “golden cross” this week (when 50DMA crosses 200DMA)!
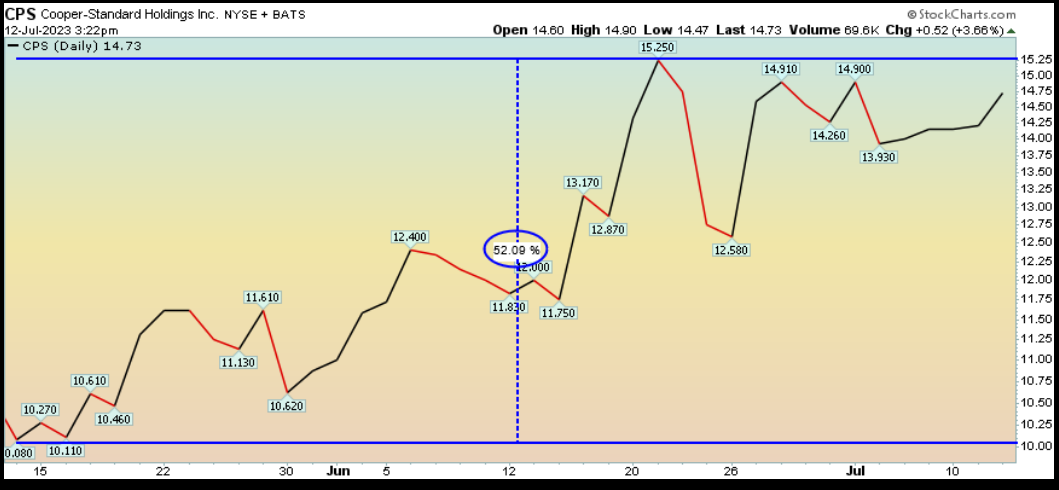
June 7, 2022 (CPS):
For the “sea change” to continue, BANKS will have to participate:
:
On Friday we will find out how aggressive the rotation will be. We anticipate positive resluts as capital markets began to open up in Q2:

What’s working so far in 2023?
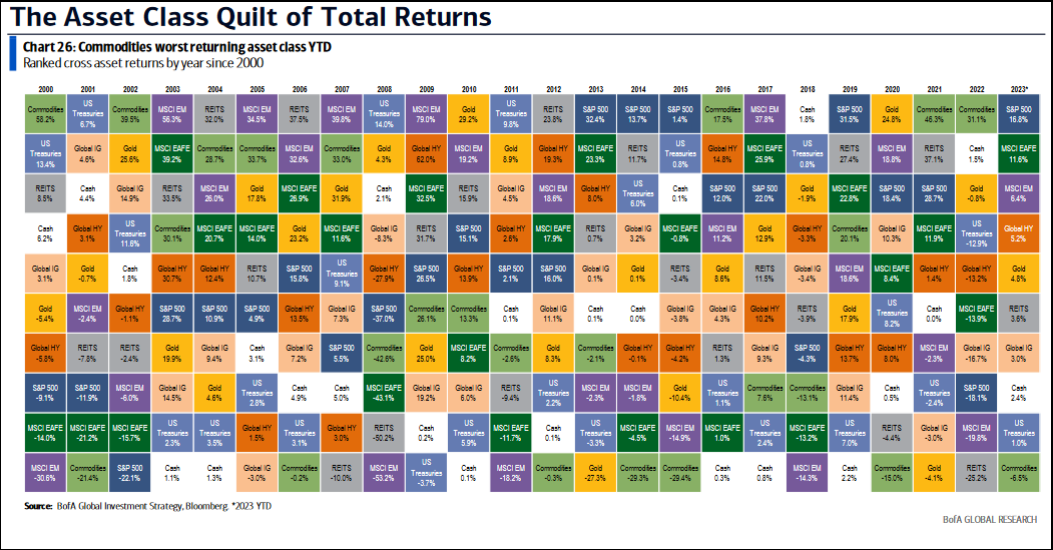 The Asset Class Quilt of Total Returns
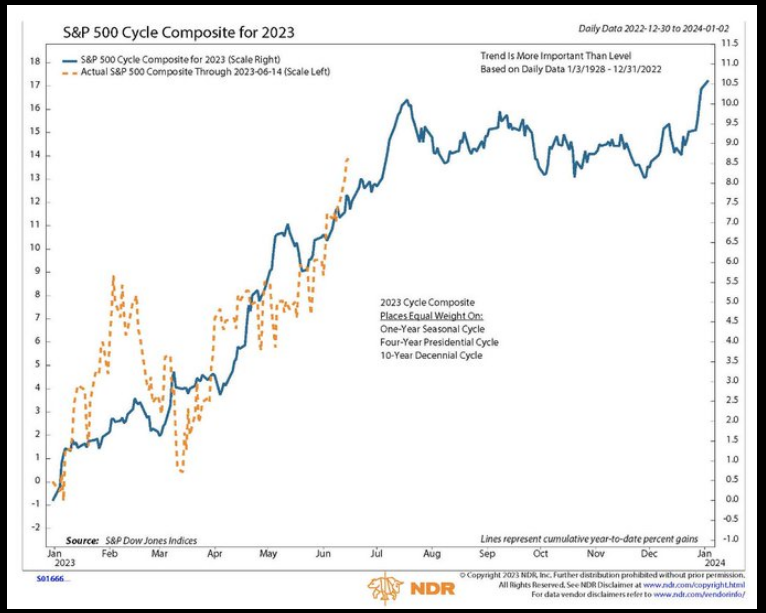 S&P 500 Cycle Composite for 2023
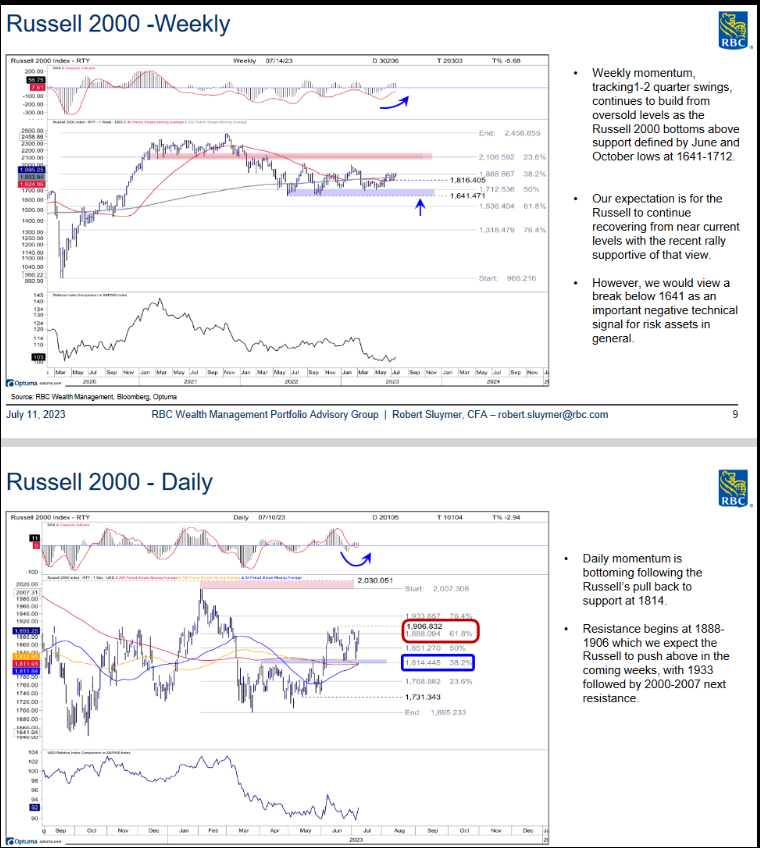 Russell 2000 Weekly/Daily
Sentiment
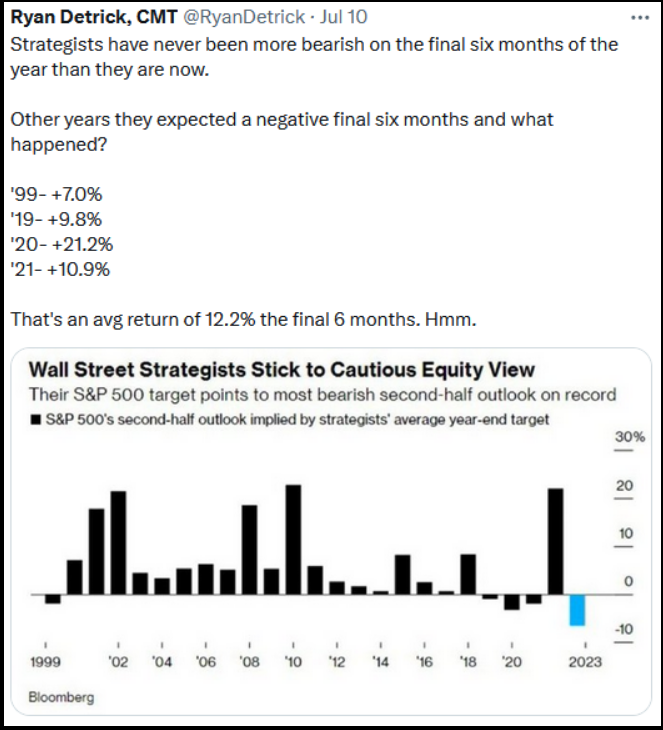 Wall Street Strategists Stick to Cautious Equity View
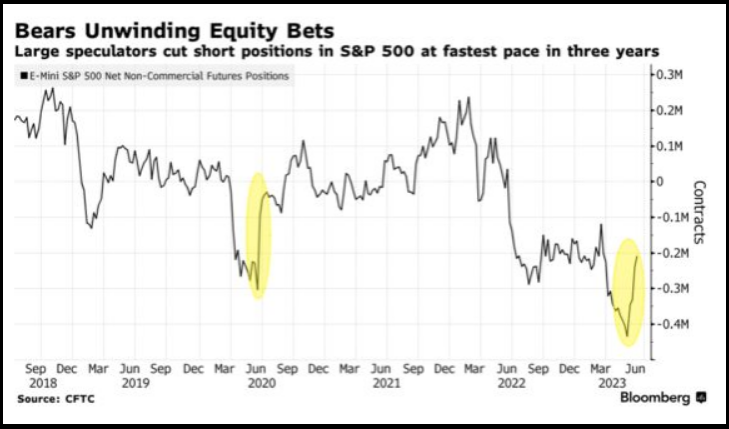 Bears Unwinding Equity Bets
Now onto the shorter term view for the General Market:
In this week’s AAII Sentiment Survey result, Bullish Percent (Video Explanation) dropped to 41% from 46.4% the previous week. Bearish Percent ticked up to 25.9% from 24.5%. The retail investor is optimistic. This can stay elevated for some time based on positioning coming into these levels, but we are watching it closely.
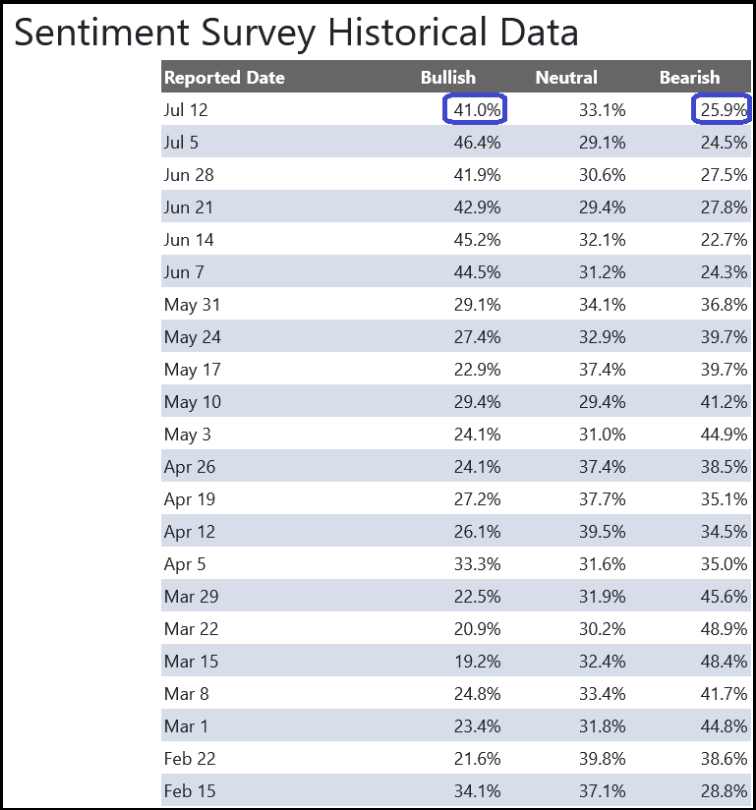 Sentiment Survery Historical Data
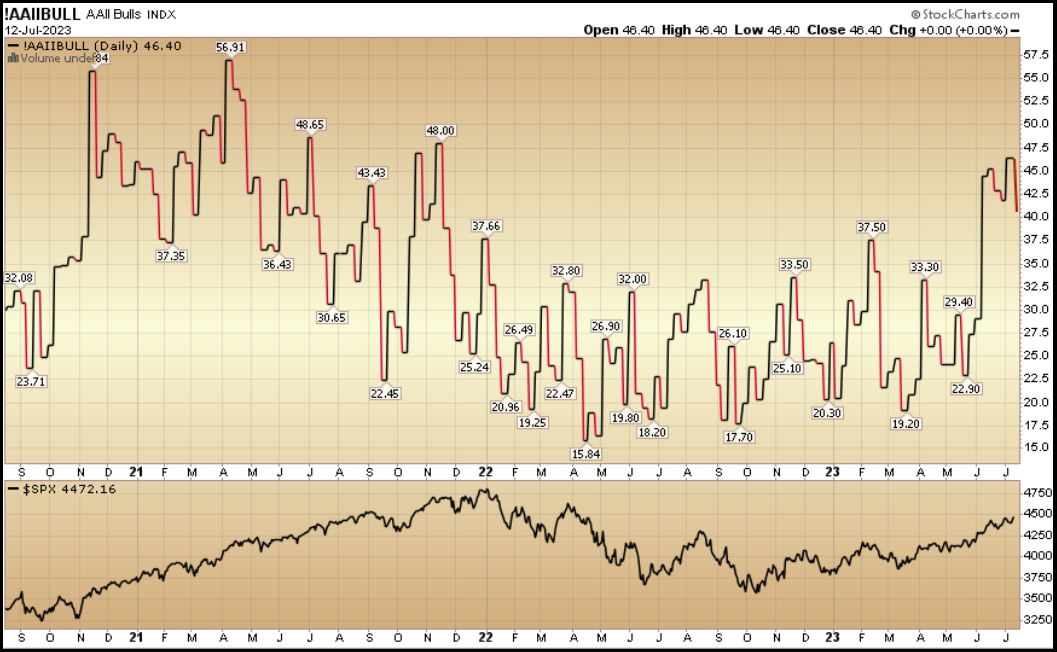
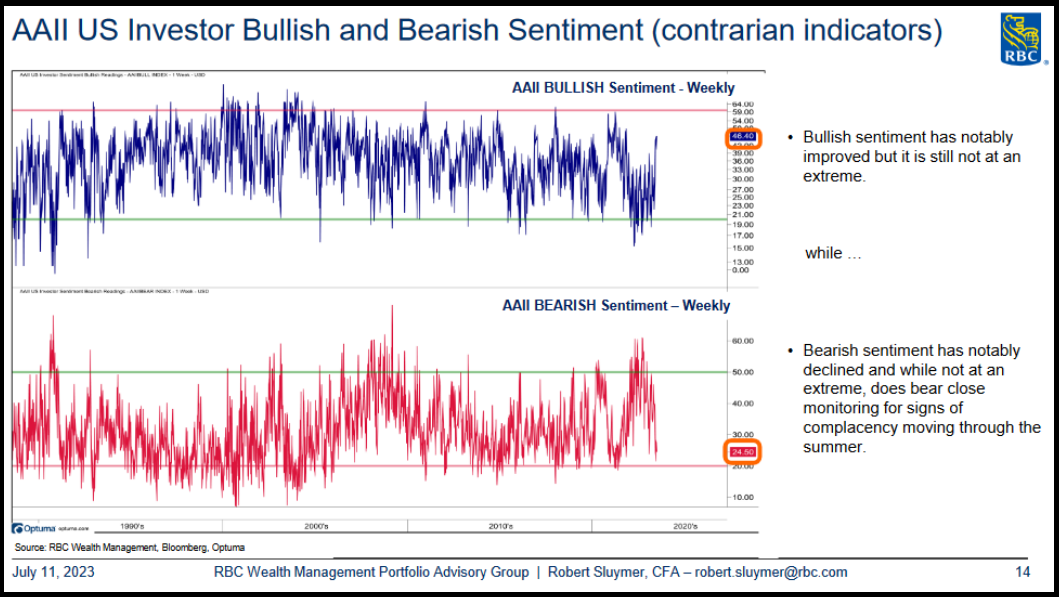 AAII US Investor Bullish and Bearish Sentiment
The CNN “Fear and Greed” flat-lined from 80 last week to 80 this week. Sentiment is hot but it would not surprise me if it stays pinned for a bit to force people out of their bunkers and back into the market. You can learn how this indicator is calculated and how it works here: (Video Explanation)
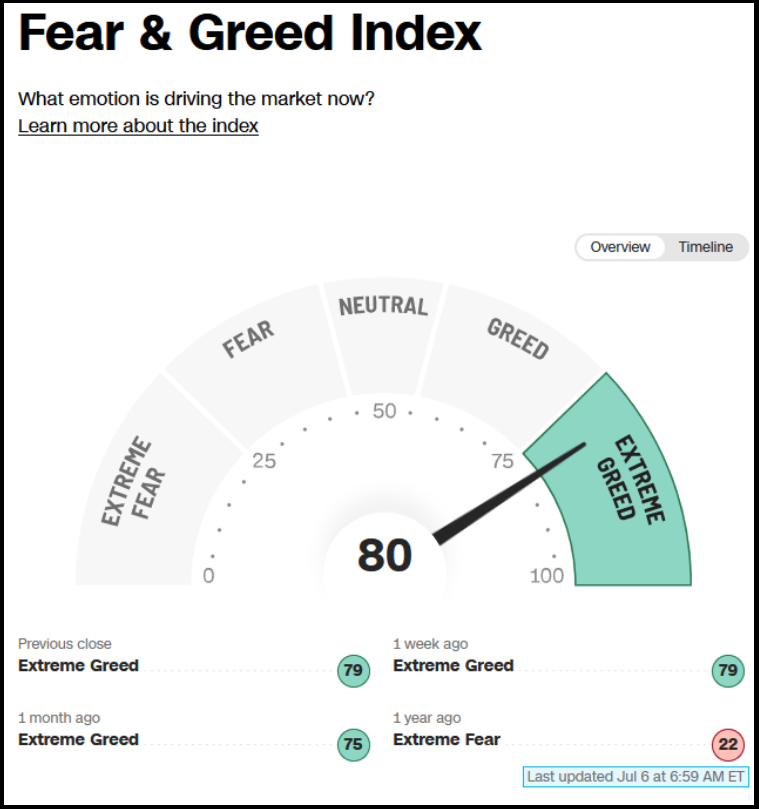
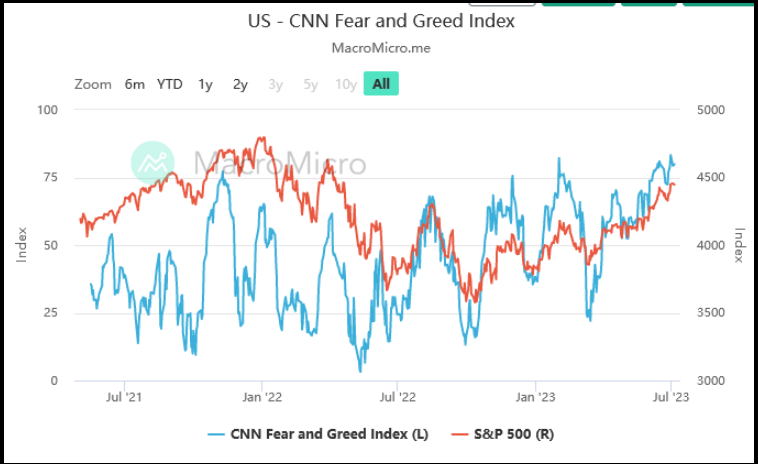 UN – CNN Fear and Greed Index
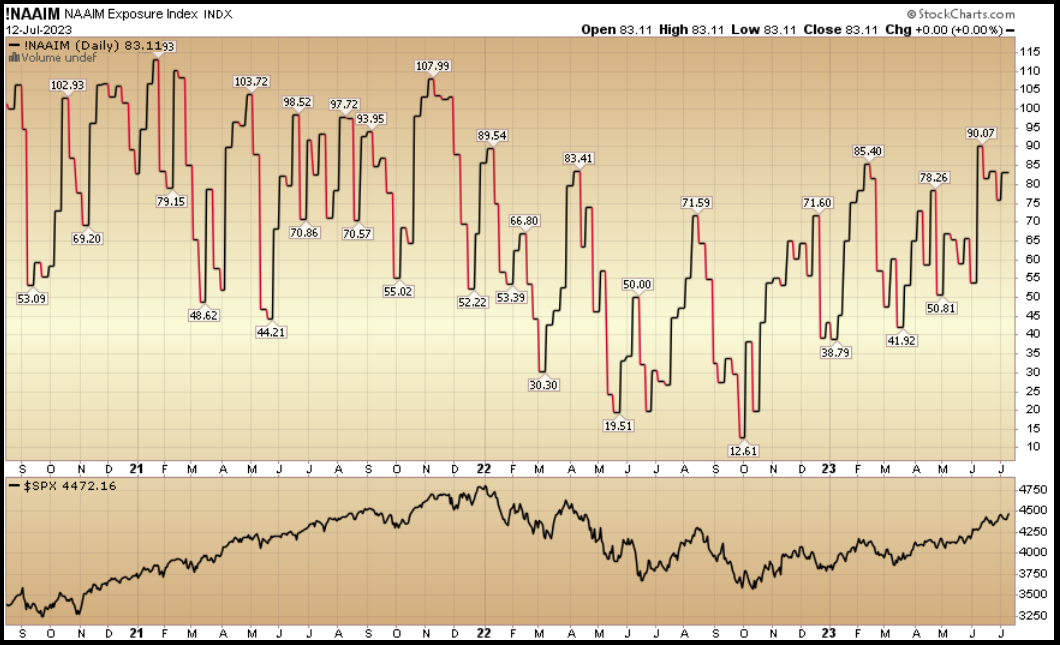
And finally, the NAAIM (National Association of Active Investment Managers Index) (Video Explanation) flat-lined to 83.11% this week from 83.6% equity exposure last week. Managers have been chasing the rally.
This content was originally published on Hedgefundtips.com.


