Inflation Deceleration Continues – But Not Enough
2024.06.19 03:18
and Median inflation continue to decline. This is not really a surprise; since early 2023 the clear direction has been to lower inflation. The debate has not been about whether inflation was heading higher or lower. The debate has been about whether the downtrend was going to converge on 2% as the Fed’s target, or fall short of that level. For at least that long, my position has been that median inflation would settle in the “high 3s/low 4s.” To date, nothing has happened to change that view.
In fact, it cannot escape notice that inflation has been coming down a lot more slowly than it went up. When the initial spike happened, certainly the ‘transitory’ crowd expected inflation would fall at least as rapidly as it went up, and even many of those who correctly understood that the underlying dynamics were not accidents of fate but the results of terrible policy thought that the return round-trip would take roughly the same amount of time as the outbound leg. But that hasn’t happened. The softening of inflation has been more reluctant than was the upward thrust. This is partly because, since the initial move in prices was not transitory, it kicked off a feedback loop: so wages went up to reflect the pressures that workers were feeling, and that fed back into inflation.
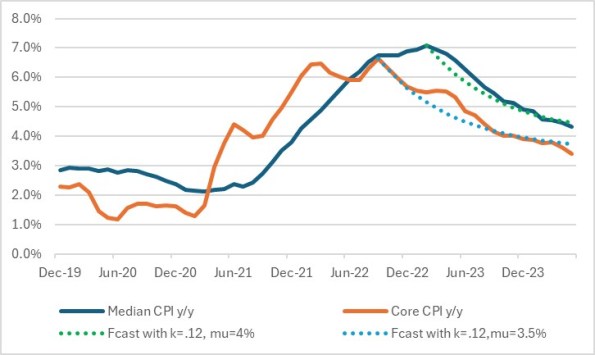
For Median CPI, the sharp acceleration took off from August 2021 at 2.4% and extended 18 months until it reached 7.1% in February 2023. In the 15 months since then, median has declined only to 4.3%, and this rate of improvement appears to be flattening out rather than accelerating.
On Core CPI, the difference has been more striking. The jump from 1.6% y/y to 6.5% y/y took 12 months, from March 2021 to March 2022. Since the actual 6.6% high in September 2022, we have had 20 months of declining inflation and core is only back to 3.4%.
The optimistic view is that we have had more months of decelerating inflation than we had of accelerating inflation. The more realistic view, especially considering that Median CPI hadn’t been above 3.33% for 28 years prior to COVID (and Core, not above 3.1%) is that inflation is converging to the mean…but to a different mean. This is what I have argued (for a long time) was happening: the perturbation to the former equilibrium displaced the whole distribution to a new equilibrium (“high 3s, low 4s”). We are now getting data that seems to support this notion.
One important characteristic of mean-reverting series is that the amount of mean-reversion “pressure” is related to the distance of the current point from the mean. That is, when inflation is far away from the mean, it tends to revert more quickly and when it is closer to the mean the pressure to converge is less. The general form of a mean-reverting series1 is:

In this equation, the economic variable is represented by the time series S, the long-term mean is μ, and the mean reversion rate is k.2 Because there is also random noise, and because many economic series don’t tend to see large perturbations on a regular basis, it is not a trivial thing to pick out the long-term mean and the reversion coefficient from the noise. But the point is that such series, when they are strongly perturbed, initially spring back rapidly but then gradually slow how much they are rebounding, until they approach the mean. That certainly looks like what we have here. The chart below shows core and median CPI, but from the point of the shock to new highs I have added ‘mean reversion lines’ where the long-term mean is taken to be 4% for Median CPI and 3.5% for Core CPI, and the mean reversion coefficient is taken to be 0.12 in each case.3

There are lots of different combinations that can produce plausible dynamics, and my point isn’t to claim that these are the right parameters. I am merely trying to illustrate that the recent behavior looks like a series that is mean reverting to new, higher means.
(For what it’s worth, if you want to see why most economists last year thought that we would be back at target inflation in late 2023/early 2024, use 2% for μ. In that case, inflation starts down much more steeply than we actually saw, and doesn’t flatten out until lower levels of inflation.)
Why is the rate of improvement slowing? It is slowing because the easiest improvements have already happened. For example, core goods inflation has declined from over 12% to -1.7% y/y. That’s great news – but the first 14% of disinflation is surely the easiest! Other, stickier parts of the CPI, such as shelter and ‘supercore’, are coming down more slowly (shelter) or not at all (supercore, which is at the same level it first reached in March 2022). In the conventional view, this is “improvement that is waiting to happen.” But if overall core/median inflation is converging to a higher mean, then these improvements will be mostly offset by an increase in core goods inflation from -1.7% to, say, 0%.
The road gets harder from here, and that’s what the decelerating deceleration is telling us!
- I’ve excised the complicated-looking, but irrelevant for this discussion, symbology for the noise term so as not to perturb readers too far from their means. ↩︎
- Worth pointing out, since I have used the ‘spring’ analogy to explain the behavior of money velocity, is that the ‘pressure’ part of this equation is identical to the physics of a spring, where F=-kx and x is displacement. ↩︎
- Actually, I’ve also removed the recursion – that is, the dotted line isn’t based on the most-recent S, but on the starting S and then thereafter on the calculated S. It would be what your mean-reversion-inspired forecast would look like, from the initial point.
Original Post


