Don’t Get Too Bearish: Market Tends to Be Up 80% of the Time
2023.09.26 05:50
- Permabears tend to lose out on gains as they sell at the first sign of trouble
- But selling during bear markets is not the key to long-term investing success
- Weathering market volatility is crucial to attaining significant profits in the long run
Ever wondered why so many people rally behind permabears, even when their track record suggests they’re often wide of the mark?
Lately, I’ve found myself mulling over this question. It seems that investors may sometimes rationalize their views incorrectly, especially in the face of losses.
They console themselves by saying, “Well, at least I didn’t lose more capital,” as they hastily exit the market.
Here’s the basic idea: if you’re bullish, you profit when stocks rise (essentially, you’re betting on an upswing), and if you’re bearish, you make gains when stocks fall (taking a short position in the market). Makes sense, right?
But here’s the twist: while this approach might seem logical, it’s not always the wisest course of action to remain steadfastly bullish or bearish.
By doing so, you’re reducing your exposure to price fluctuations and shifting your funds from stocks to cash in an effort to minimize risk.
However, in the quest to eliminate risk, you also forfeit potential gains, whether your bearish or bullish prediction proves correct or not. In fact, to achieve our financial objectives, it’s essential to stay in the market and endure the occasional bouts of short-term turbulence.
So while the market is definitely giving investors many short-term bearish indicators, the trick is to adapt accordingly without losing focus on the long-term strategy.
Let’s take a look at the current state of the market.
US Dollar Continues to Rally
Meanwhile, the is once again in focus as it stages a robust comeback with a gain of over 5% following a 3.5% dip in July.
 The US dollar index is presently hovering around the same levels it recorded back in March 2023, marking more than nine consecutive weeks of gains. This trend bears a resemblance to its performance in 2014-2015.
What makes this particularly noteworthy is that the current DXY level represents a significant psychological resistance point, based on its historical rejections and struggles to break to the upside. This was also observed in January 2023.
If the DXY were to experience a subsequent increase, it would undoubtedly exert pressure on the stock market. This scenario is less than ideal for bullish investors.
Stocks Remain Bearish Compared to Commodities
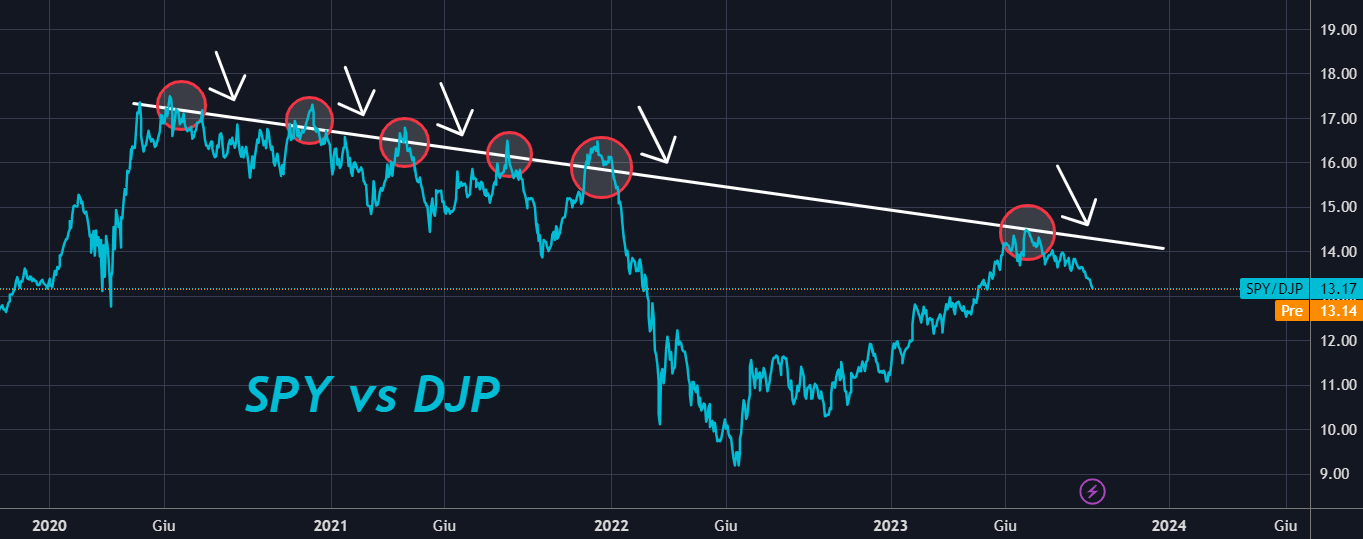
The most important relationship that is often overlooked is between equities and commodities, the former are already in their fourth year of a bearish trend compared to the latter.

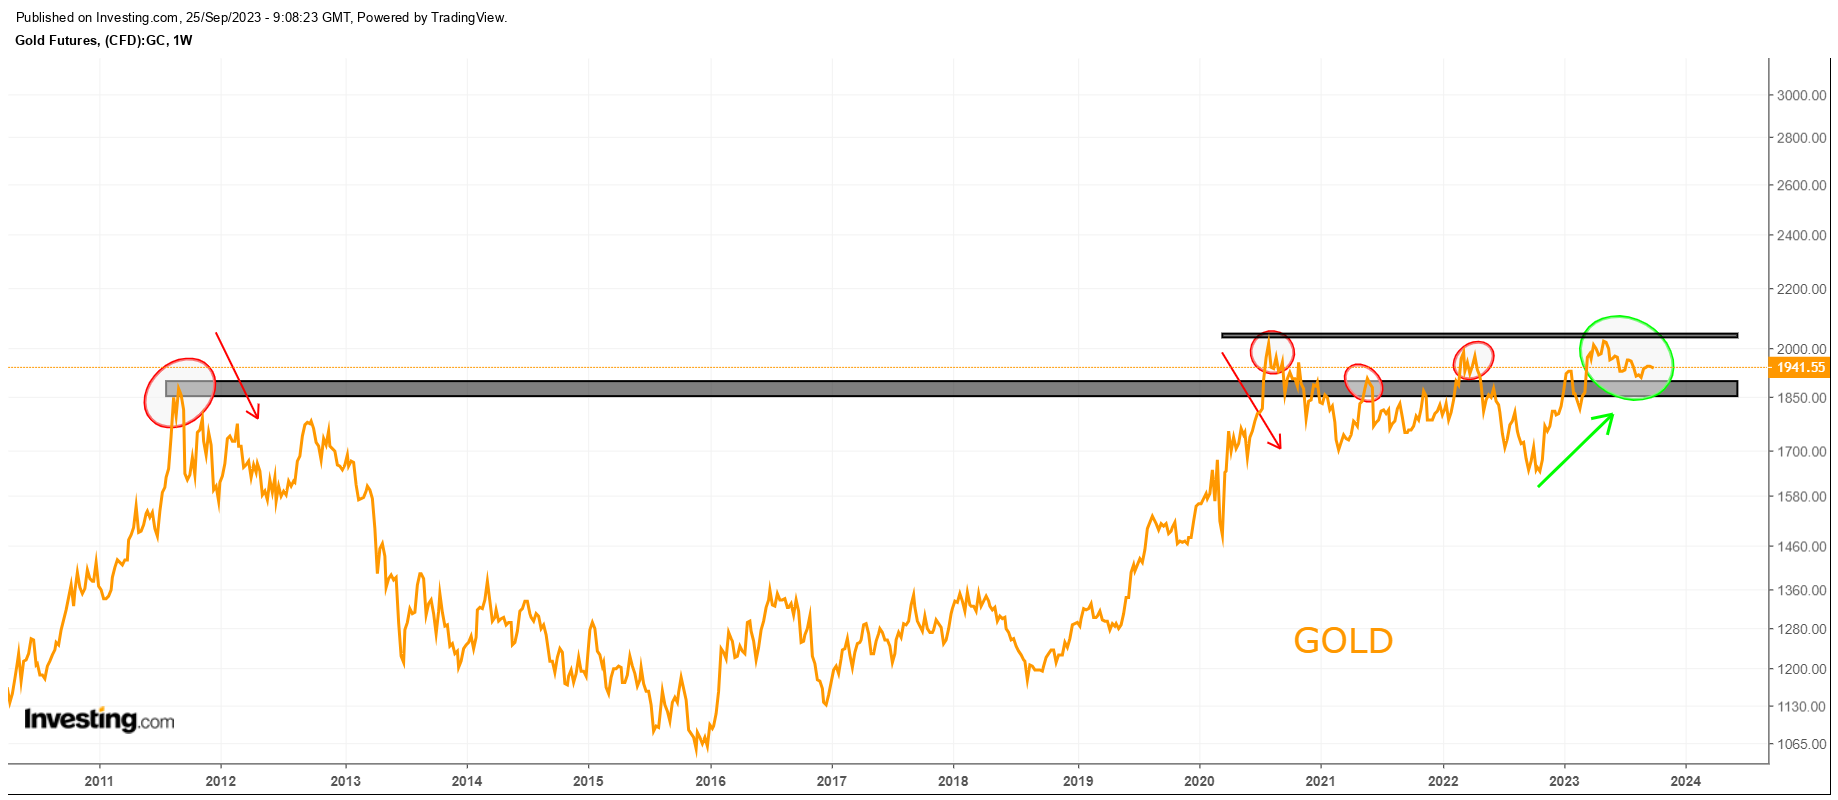
If one hadn’t looked at the : ratio chart, it might have been hard to believe. Further confirming this is ‘s price action.
 If the current breakout can be sustained, and we see the price breaking above $2050, it could provide significant momentum to the entire sector.
Bottom Line
In conclusion, while several factors can point toward declines in the near term, it is important to be aware of the potential risks and rewards of both bullish and bearish positions.
While it may be tempting to stick to a single stance, it is often more prudent to be flexible and adapt your strategy to the changing market conditions.
Additionally, it is important to remember that the market tends to be positive 80% of the time. This means that investors who are too bearish may miss out on significant profits.
Ultimately, the best way to achieve your financial goals is to stay invested in the market and ride out the occasional periods of volatility.
***

Find All the Info you Need on InvestingPro!
Disclaimer: This article is written for informational purposes only; it does not constitute a solicitation, offer, advice, or recommendation to invest as such it is not intended to incentivize the purchase of assets in any way. I would like to remind you that any type of asset, is evaluated from multiple perspectives and is highly risky therefore, any investment decision and the associated risk remains with the investor.


