World factory activity shrinks as China, slowing growth take toll
2023.08.01 08:43

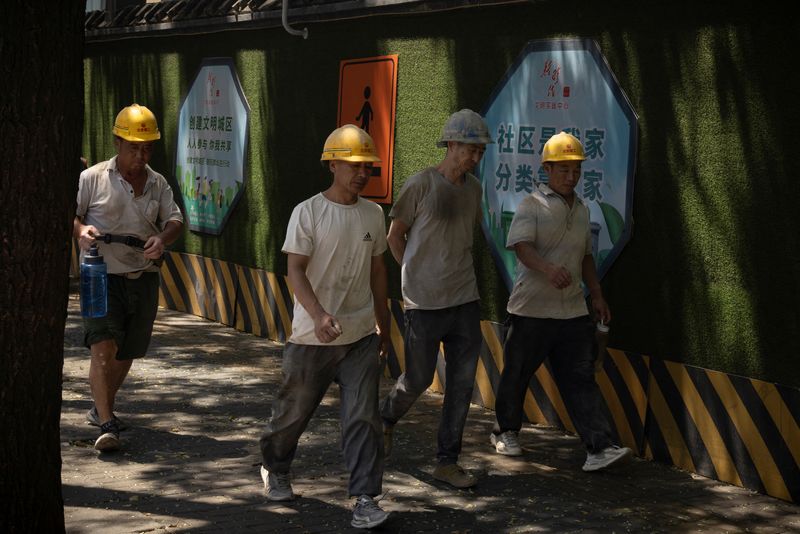
© Reuters. FILE PHOTO: Workers walk in a street in Beijing, China, July 14, 2023. REUTERS/Thomas Peter/file photo
By Jonathan Cable and Leika Kihara
LONDON/TOKYO (Reuters) -Global factory activity took a further turn for the worse in July, private surveys showed on Tuesday, a sign slowing growth and weakness in China were taking a toll on the world economy.
The downturn highlights the dilemma for policymakers who embarked on aggressive tightening cycles in a battle to keep inflation at bay and yet also need to try and forestall potential recessions.
A Purchasing Managers’ Index (PMI) covering the euro zone as a whole showed manufacturing activity contracted in July at the fastest pace since COVID was cementing its grip on the world as demand slumped despite factories cutting their prices sharply.
There was considerable weakness in Germany, Europe’s largest economy, while France and Italy, the second- and third-largest euro zone economies, also recorded marked deteriorations since June.
HCOB’s final euro zone manufacturing PMI, compiled by S&P Global (NYSE:), fell to 42.7 in July from June’s 43.4, its lowest since May 2020 and matching a preliminary reading. A reading below 50 marks a contraction in activity.
An index measuring output, which feeds into a composite PMI due on Thursday and seen as a good gauge of economic health, dropped to 42.7 from 44.2, a low not seen in over three years.
The manufacturing downturn in Germany deepened at the start of the third quarter as goods producers recorded sharper declines in new orders, data showed.
Meanwhile, France’s factory sector contracted further in July although the downturn was not quite as bad as first forecast.
“Today’s PMI results are an indicator of the ongoing uncertainty that the euro zone manufacturing sector is currently facing,” said Thomas Rinn, global industrial lead at Accenture (NYSE:).
“Demand is going through a rocky patch. Dwindling output coupled with the knock-on effects of inflation, labour shortages and shifting customer preferences, all continue to put a squeeze on businesses.”
In Britain, outside the European Union, factory output contracted in July at the fastest pace in seven months, hit by higher interest rates and fewer new orders, despite weakening price pressures.
ASIAN STRAIN
Japan, South Korea, Taiwan and Vietnam saw manufacturing activity contract in July, surveys showed, highlighting the strain sluggish Chinese demand is inflicting on the region.
China’s Caixin/S&P Global manufacturing PMI fell to 49.2 in July from 50.5 in June, missing analysts’ forecasts of 50.3 and marking the first decline in activity since April.
The data was in line with the government’s official PMI on Monday, raising challenges for policymakers seeking to revive momentum in China’s post-COVID recovery.
“Manufacturing PMIs remained in contractionary territory across most of emerging Asia last month and the underlying data point to further weakness ahead,” said Shivaan Tandon, emerging Asia economist at Capital Economics.
“Falling new orders, bleak employment prospects and high inventory levels point to subdued factory activity in the coming months.”
Japan’s final au Jibun Bank PMI fell to 49.6 in July, from 49.8 in June, due to weak domestic and overseas demand.
South Korea’s PMI stood at 49.4 in July, up from 47.8 in June but staying below the 50-threshold, a survey by S&P Global showed.
Taiwan’s manufacturing PMI fell to 44.1 in July from 44.8 in June, while the index for Vietnam rose to 48.7 from 46.2, surveys showed.
In India, growth in manufacturing activity slowed for a second month, but the pace of expansion remained healthy and beat expectations.
Asia has been among the few bright spots in the global economy, though China’s slowdown clouds the outlook.
In revised forecasts issued in July, the International Monetary Fund projects emerging Asia’s economic growth will accelerate to 5.3% this year from 4.5% in 2022. It expects China’s economy to expand 5.2% this year after a 3.0% increase in 2022.


