Why Small Caps Deserve a Spot in Your 2025 Portfolio
2024.12.07 13:55
- The Russell 2000 offers a unique mix of high volatility and potential for outsized returns.
- Despite its wild swings, the index has consistently posted solid long-term returns.
- Small caps remain an appealing diversification tool, but be ready for the market’s rollercoaster ride.
When it comes to uncovering growth and diversification in the U.S. stock market, the has long been a favorite among investors.
As a benchmark for small-cap equities since its inception in 1984, the index offers a dynamic window into America’s economic engine, capturing the performance of approximately 2,000 companies with market caps ranging from $300 million to $2 billion.
From tech startups to healthcare innovators, these small but mighty players provide a unique mix of higher volatility and the potential for outsized returns—making the Russell 2000 a fascinating, albeit risky, addition to any portfolio.
While the index has delivered an impressive annualized return of 9.8%—on par with its larger-cap counterpart, the —it comes with 20-25% greater volatility.
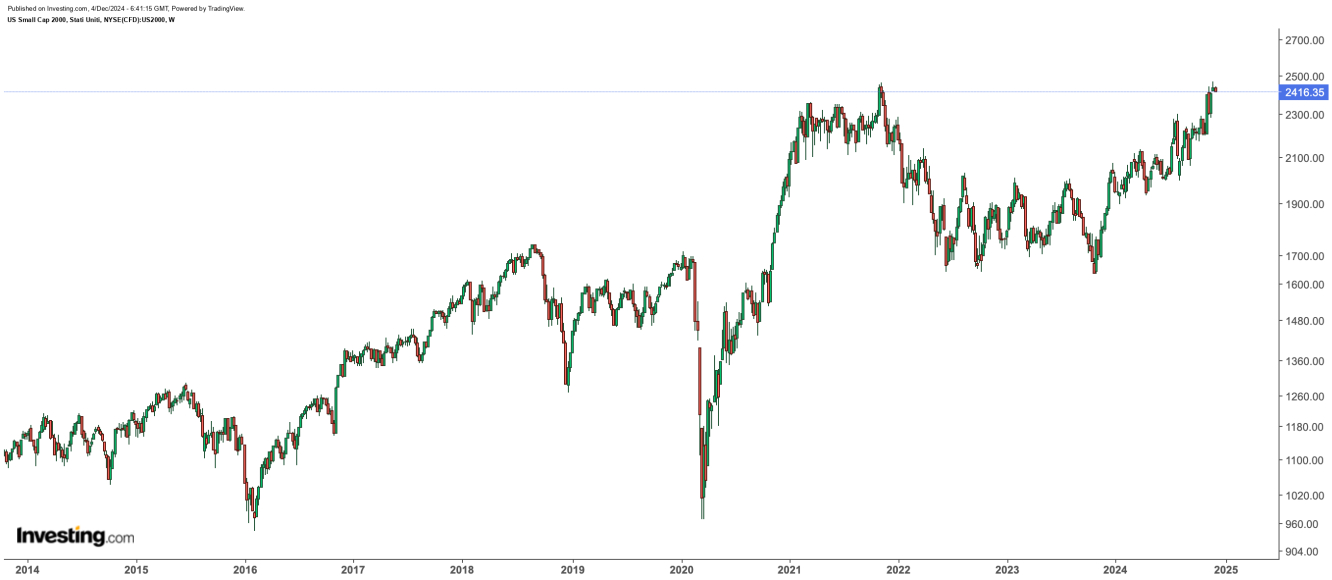
This rollercoaster nature has defined its performance, as evidenced by the massive swings during major crises and rebounds.
Yet, the index continues to recover, recently retesting all-time highs after lagging behind broader benchmarks during the latest rally.
A Historical Look at Returns
Over the decades, the Russell 2000 has demonstrated its resilience, posting solid returns even amid economic headwinds:
- 1984-1990: +8.3% annualized return
- 1990-2000: +12.5% annualized return
- 2000-2010: +5.8% annualized return
- 2010-2020: +11.7% annualized return
- 2020-2023: +7.9% annualized return
These figures highlight the index’s ability to recover and thrive over the long term, rewarding patient investors willing to weather its ups and downs.
Volatility: The Double-Edged Sword
Small caps are notoriously sensitive to economic cycles, with the Russell 2000 often bearing the brunt of market downturns before rebounding sharply.
During the 2008 financial crisis, the index tumbled 38.5%. Similarly, the onset of COVID-19 in 2020 triggered a 41.2% drop, only to be followed by a remarkable 50% recovery by the end of 2021.
Sector composition also plays a role in this volatility, with the index’s top industries—technology (NYSE:) (22%), healthcare (NYSE:) (18%), and finance (NYSE:) (15%)—exposing it to rapid shifts in market sentiment.
Performance in Major Market Crashes
The Russell 2000’s reaction to market crises underscores its higher-risk nature:
- 2000-2002 Dot-com collapse: Cumulative loss of 32%
- 2008 Financial crisis: 38.5% single-year drop
- 2020 COVID-19 pandemic: 41.2% initial plunge, followed by a strong recovery
Such volatility emphasizes the importance of a long-term horizon and careful portfolio management when investing in small caps.
Should You Consider Small Caps Now?
Despite its wild swings, the Russell 2000 remains an appealing tool for diversification. By investing in small caps, you gain exposure to fast-growing companies that can outperform during economic expansions.

As of now, small caps have delivered an attractive +31.51% return since October 2023, when they were added to our portfolio through a global ETF.
However, their heightened sensitivity to economic cycles means they aren’t for the faint of heart. A slowing U.S. economy—or an outright downturn—could spark further declines.
As always, disciplined money management and a long-term perspective are crucial when navigating this segment of the market.
Whether you’re seeking growth, diversification, or simply looking to explore a more dynamic corner of the stock market, the Russell 2000 offers plenty of reasons to keep it on your radar—just be prepared for the ride.
***
Disclaimer: This article is written for informational purposes only. It is not intended to encourage the purchase of assets in any way, nor does it constitute a solicitation, offer, recommendation or suggestion to invest. I would like to remind you that all assets are evaluated from multiple perspectives and are highly risky, so any investment decision and the associated risk rests with the investor. We also do not provide any investment advisory services.


