What’s Driving US Dollar Strength Against Euro, Ruble and Yuan?
2023.09.08 11:41
- The dollar is being supported by strong economic data from the US, as well as the ongoing interest rate hike cycle.
- The euro is being weighed down by concerns about the European Central Bank’s ability to raise interest rates.
- Meanwhile, the Chinese yuan is being weakened by China’s economic slowdown, and sanctions are weighing on the ruble
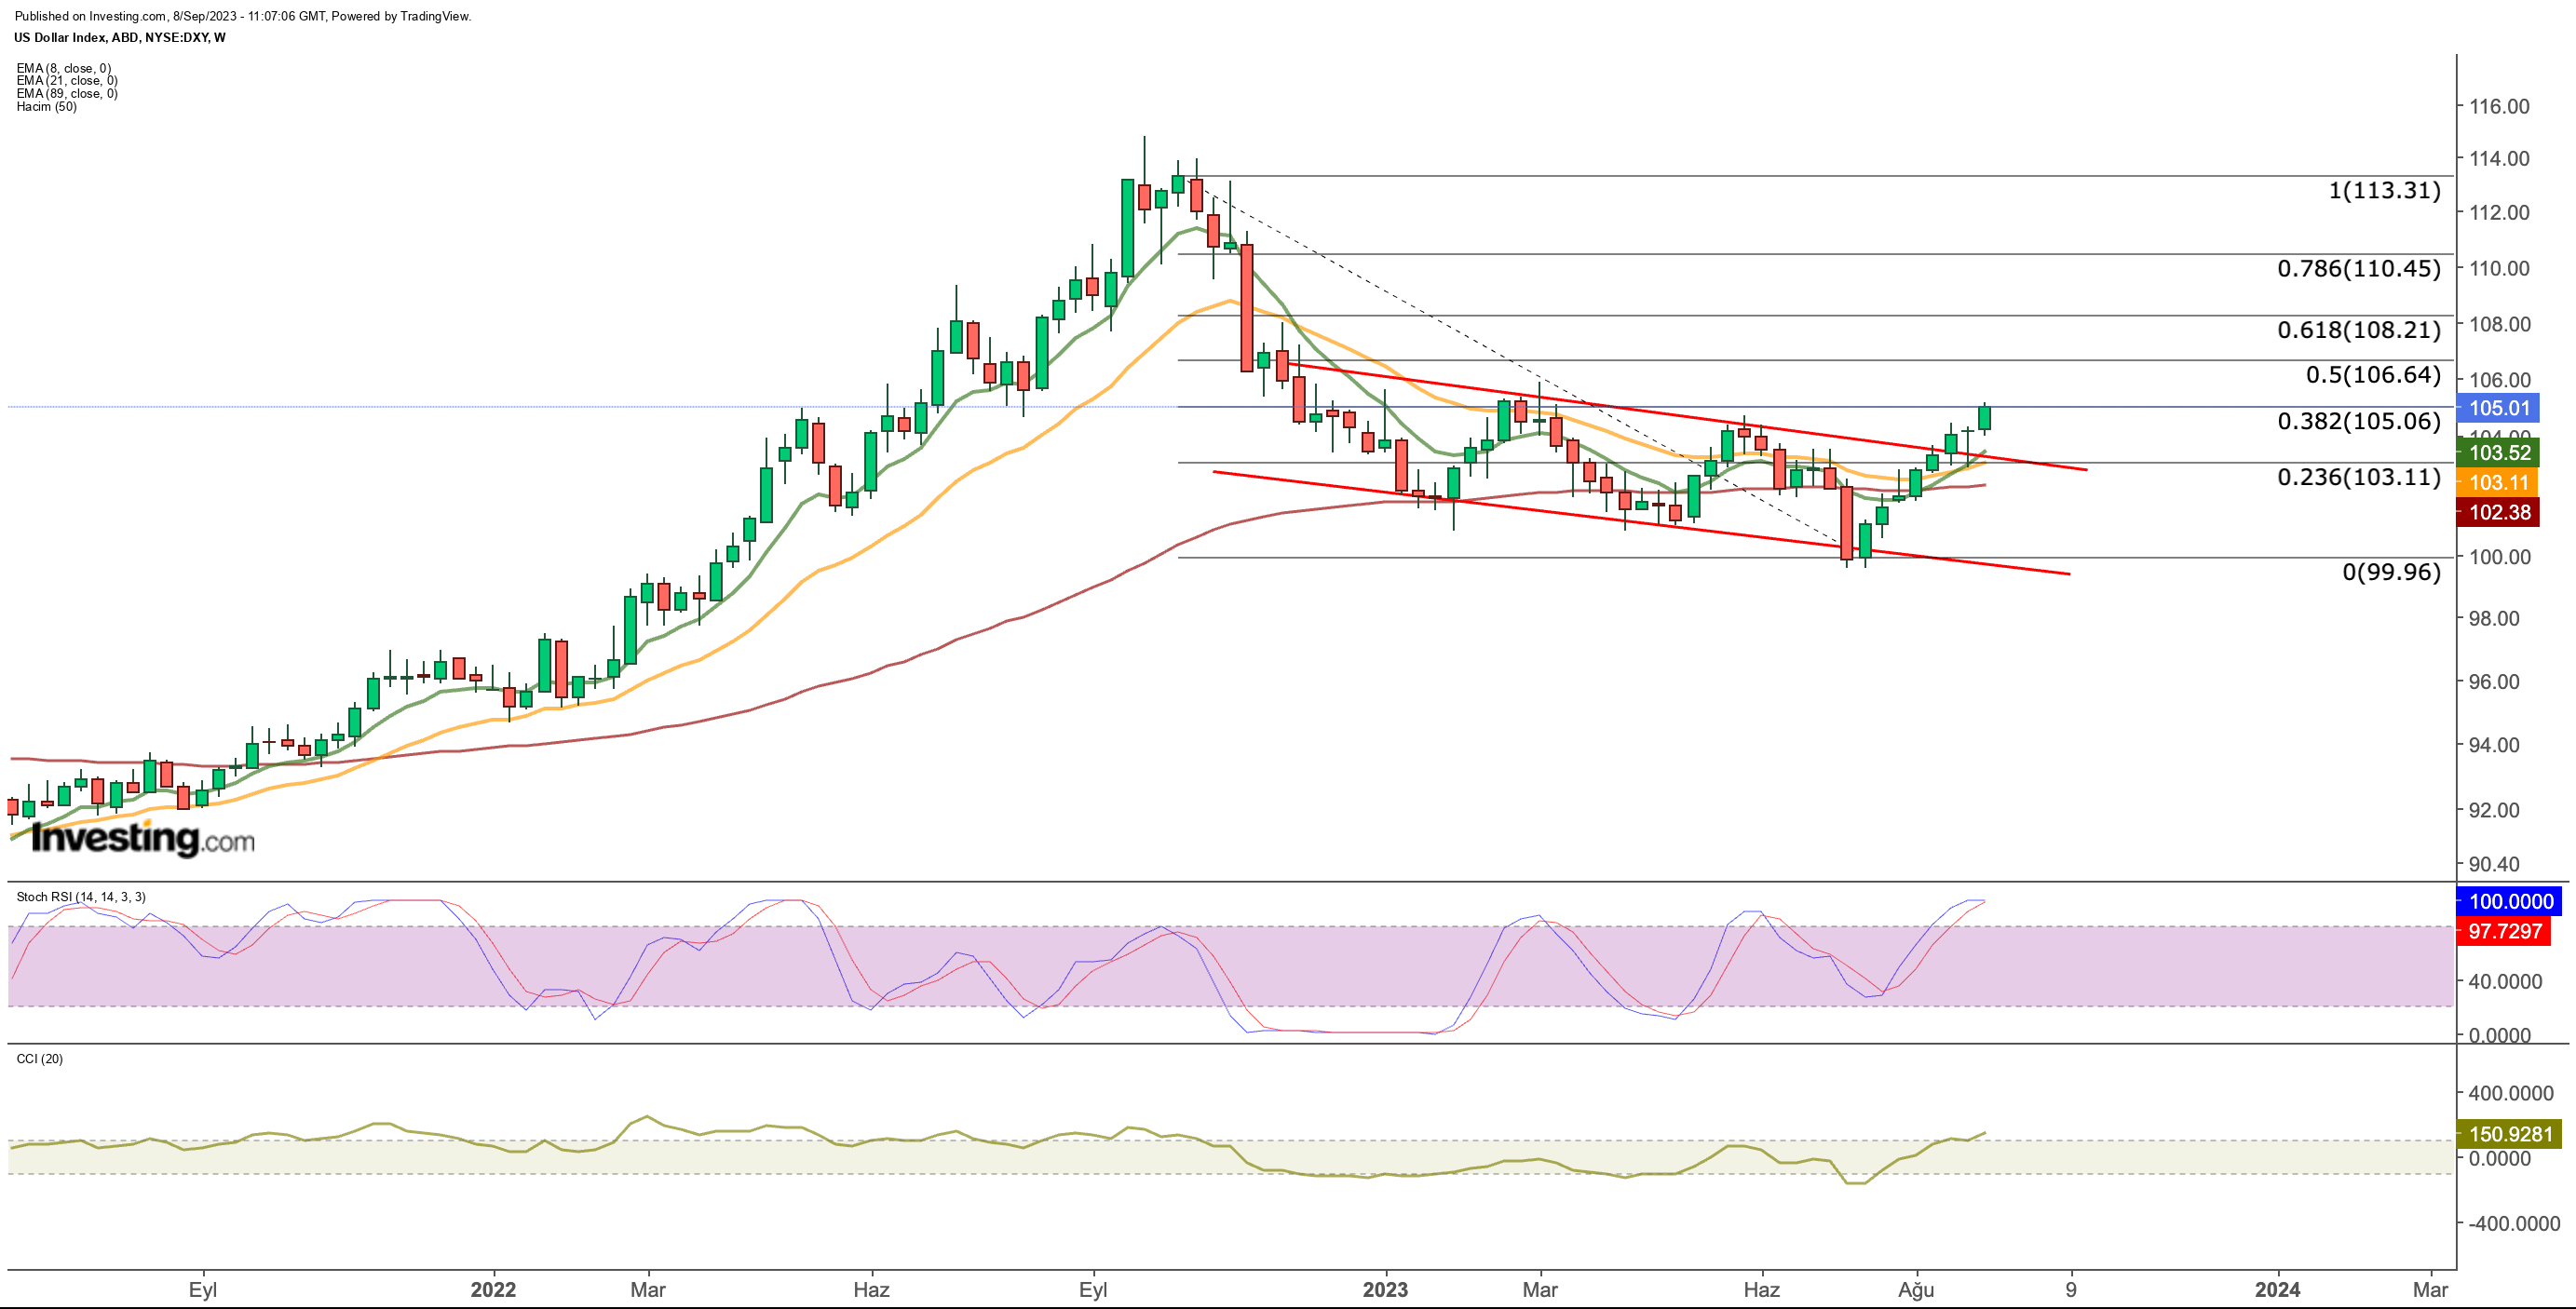
Maintaining its upward trajectory since July, the entered the 105 range this week and began testing the March peak.
Several factors driving demand for the dollar are contributing to its global strengthening, reversing a year-long downtrend. Foremost among these factors is robust economic data from the US.
Moreover, a seasonal effect is currently favoring the dollar, as historical data indicates that demand for the dollar tends to surge during September.
This increase in demand, combined with the ongoing interest rate hike cycle in the latter half of 2023 in a macroeconomically uncertain environment, has made the dollar particularly attractive.
While the dollar continues to appreciate against the currencies of developed nations comprising the index, it is also gaining value against the currencies of other major economies, such as China and Russia.
US Dollar Tests March Peak: Can it Break Through?

The DXY has strengthened within the bearish channel after stabilizing around the 100 level earlier this year.
The DXY is currently testing the critical resistance point at 105, which corresponds to the Fib 0.382 level, based on the recent downtrend.
This level also aligns with the peak observed during the recovery efforts in March. If the DXY can close the week above 105, it may signal a potential target of 108.
Furthermore, in the short and medium term, EMA values have begun to support this upward trend as of this week. The only technical concern at this juncture is the Stochastic RSI indicator, which is approaching the overbought zone.
This indicator, which previously signaled a return to the March and June peaks, is currently positioned above these peaks.
Considering the fundamental factors, it’s possible that the DXY could face short-term resistance at its current levels and experience a temporary pullback towards the 103 level.
Such a move would also entail a retest of the upper boundary of the descending channel.
EUR/USD: Euro Continues to Weaken Against the Dollar
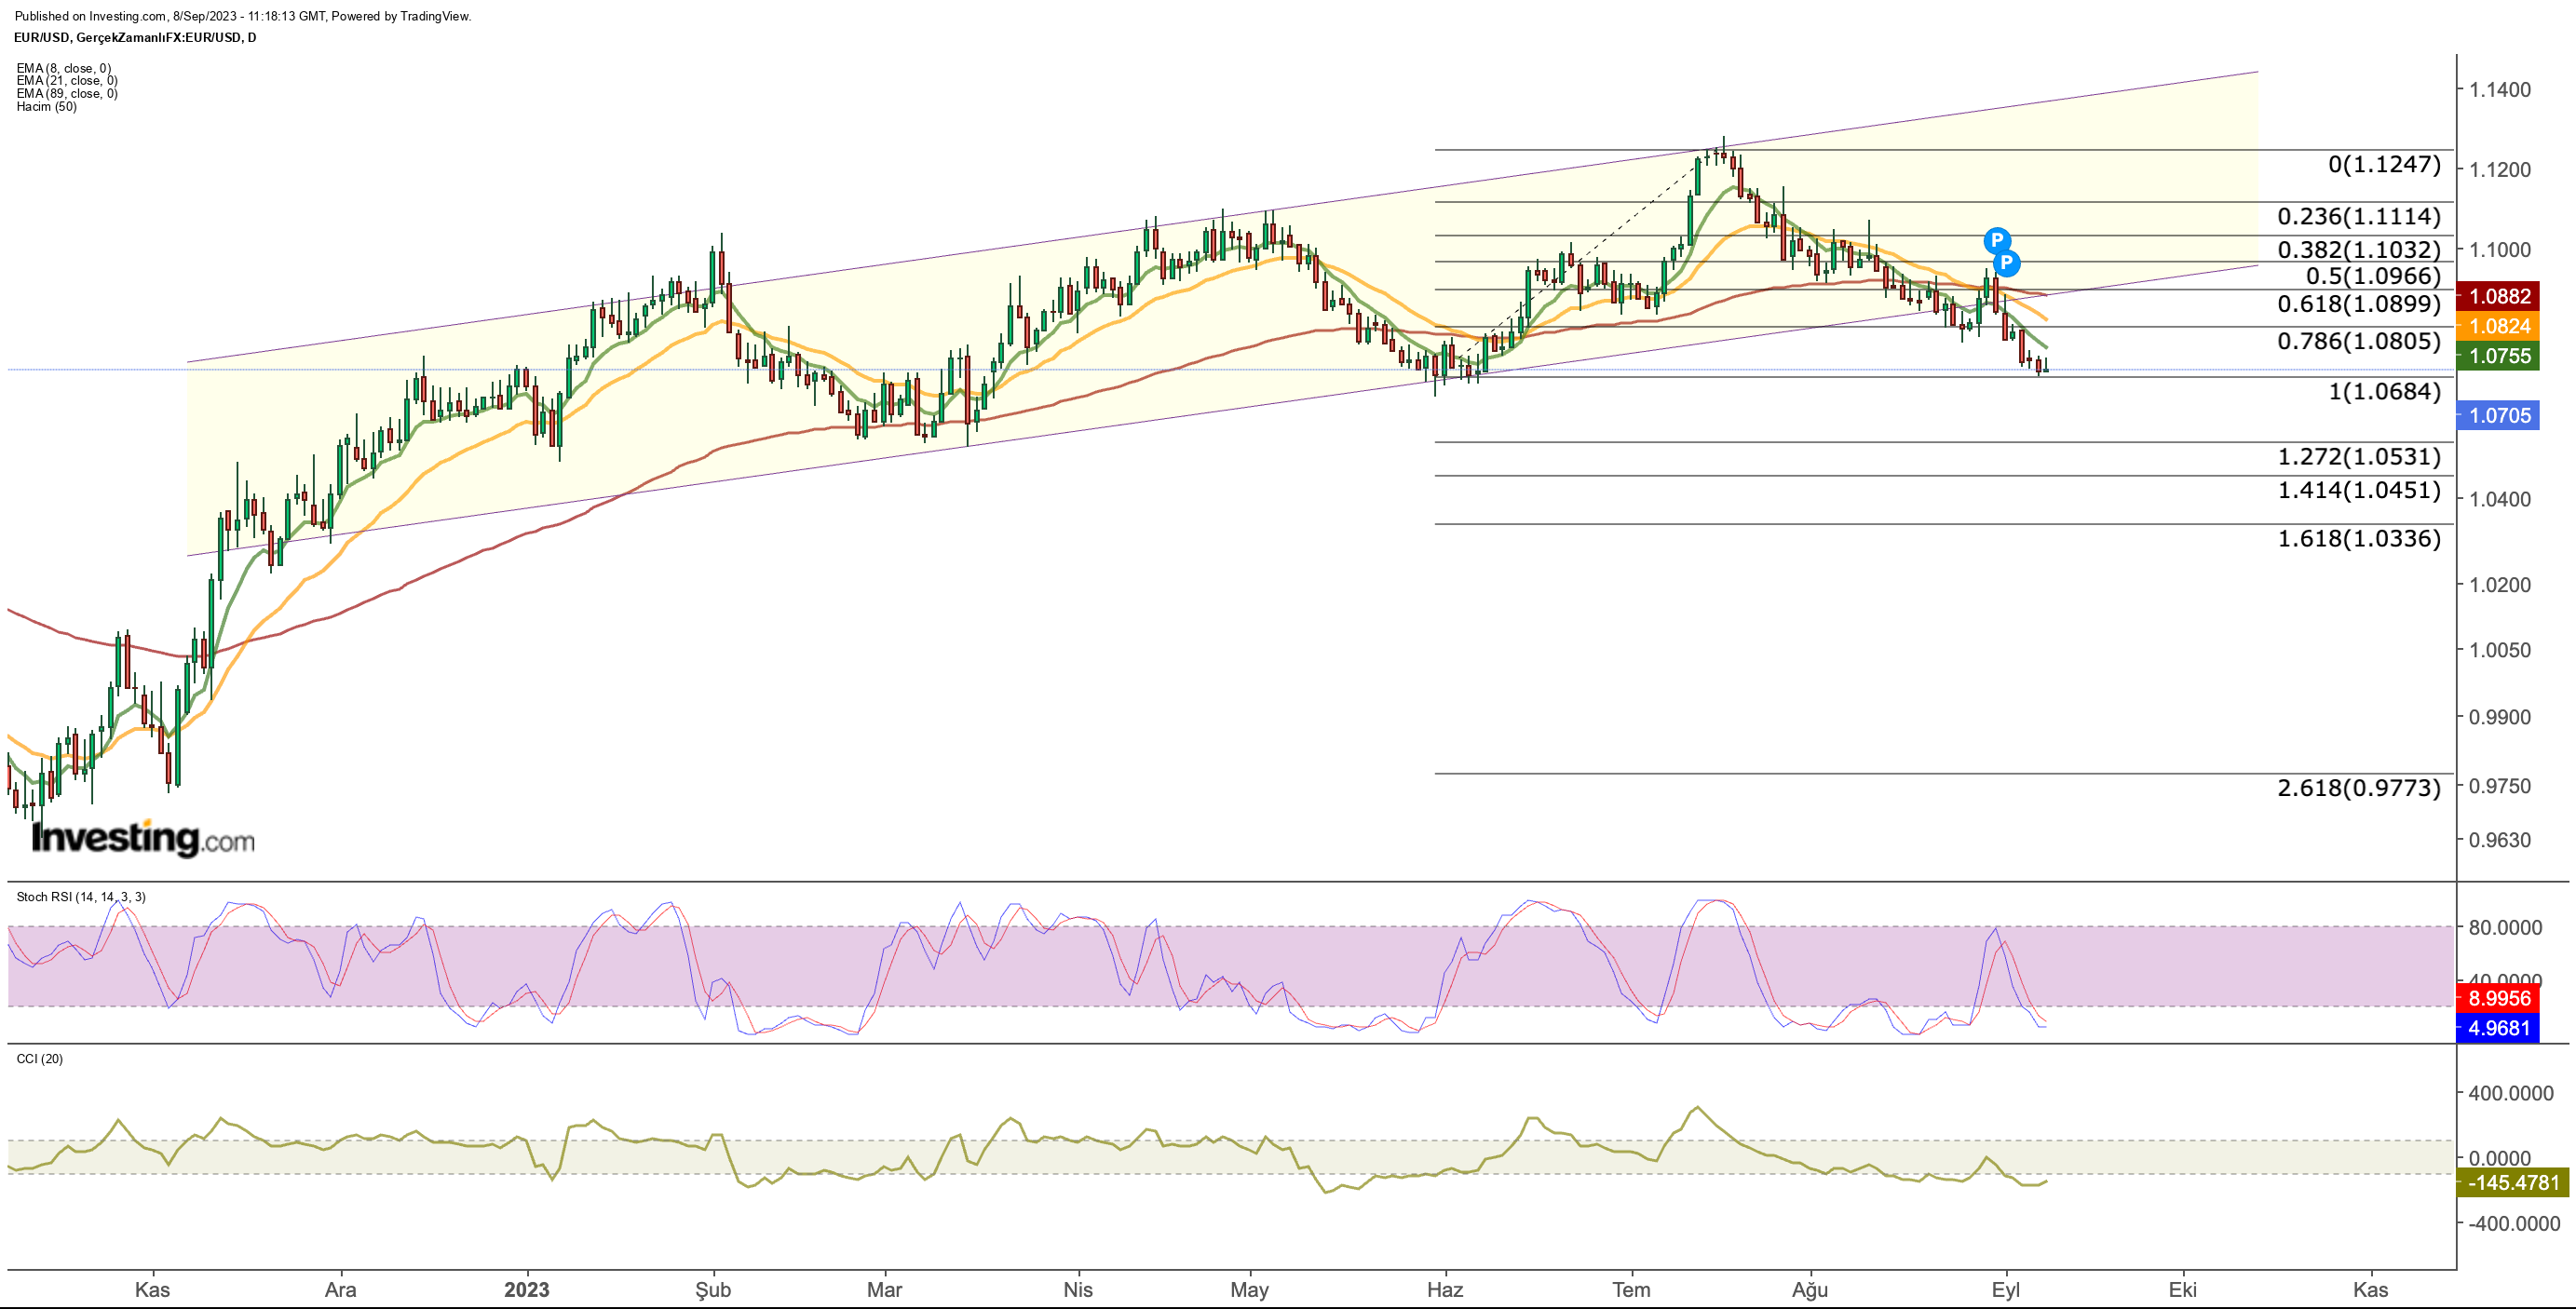
The pair has recently breached the lower boundary of its bullish channel as of September. With the euro showing signs of weakness, the pair has descended this week to approximately $1.06, a level where it found support back in May.

Considering the recovery observed between June and July, it’s plausible that the retreat may persist, potentially bringing the EUR/USD pair down to the $1.03 – $1.05 range after the loss of the $1.06 level.
If there’s a rebound from the current levels, the $1.08 region will become a significant point to monitor.
However, should a potential partial recovery towards the $1.08 region fail to materialize, it could act as a trigger for a more pronounced retracement of the EUR/USD pair.
USD/CNY: Yuan Falls on China’s Economic Woes
The yuan continues to be among the worst-performing currencies in the Far East as China loses momentum on its post-pandemic recovery path.

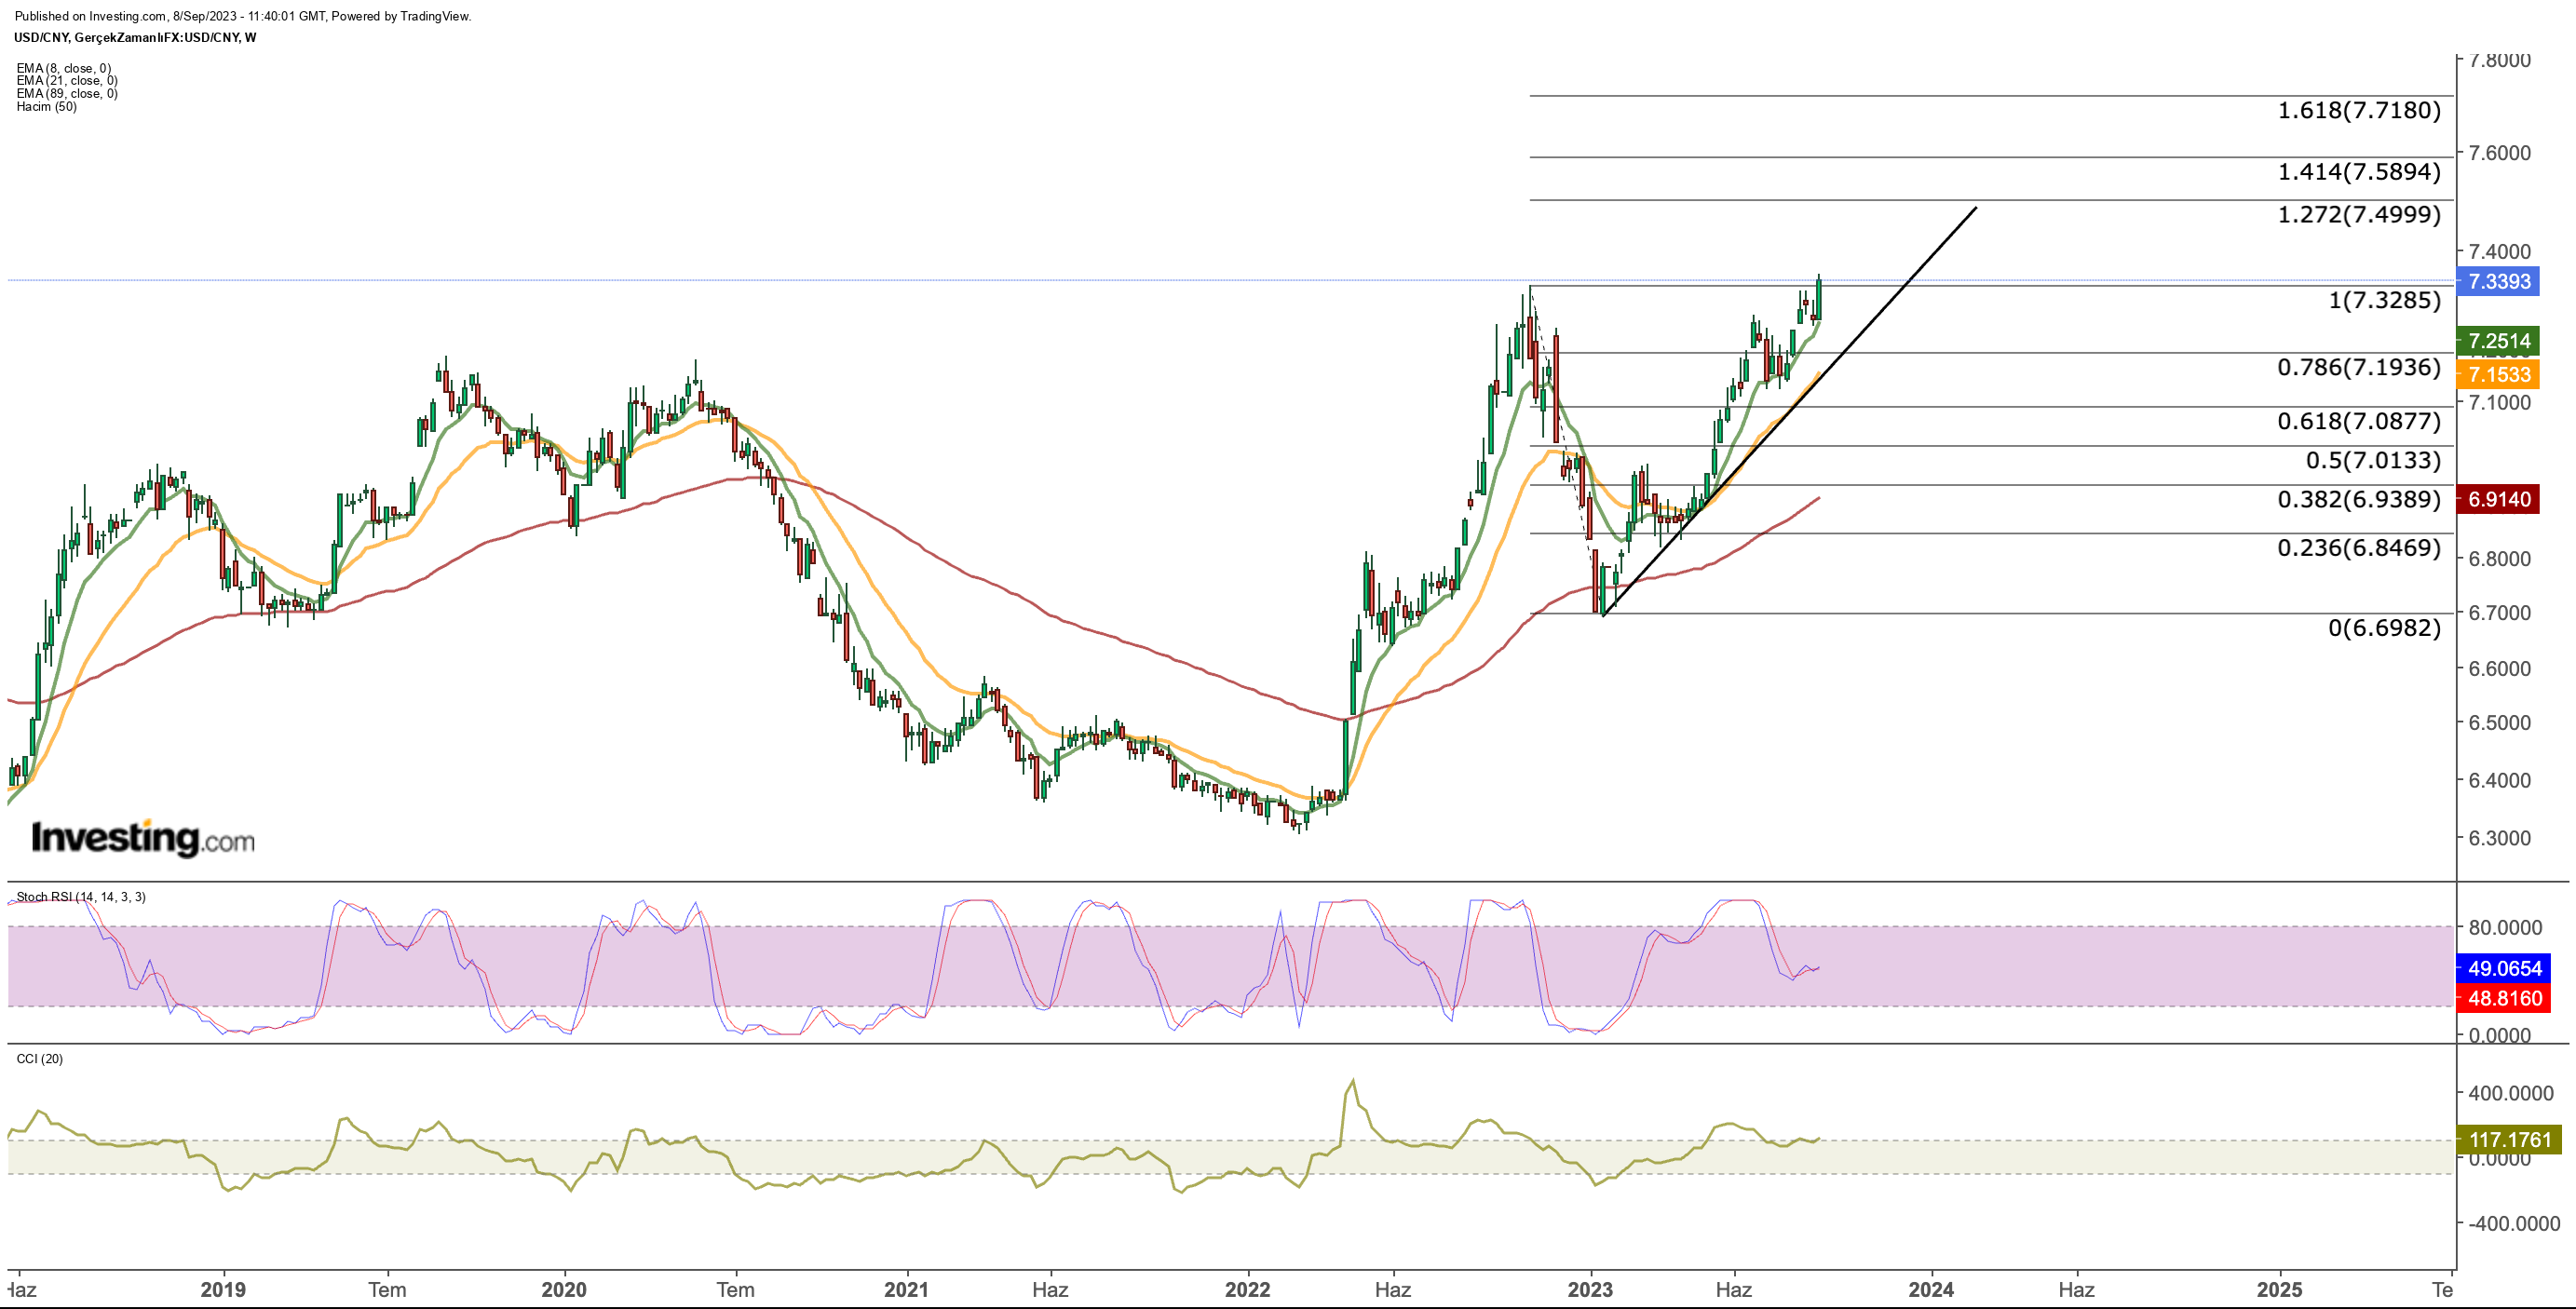
While the yuan has remained partially resilient against the dollar in the last two weeks, it closed the week at 7.33 with a 1% depreciation this week. Thus, parity recorded a new high after October 2022.
While the current outlook shows that the possibility of a recovery in the short term is weak, the upward movement of USD/CNY may continue. Technically, after exceeding the last peak, the pair may continue its movement towards the 7.5 band as long as it remains above 7.33.
USD/RUB: Ruble Set to Soar?
The pair has been under close scrutiny recently due to several key factors. Russia’s ongoing conflict with Ukraine, its decision to limit oil exports in collaboration with Saudi Arabia until the end of the year (expected to impact energy prices), and discussions with Turkey regarding a grain corridor have kept Russia in the global spotlight.

Simultaneously, Russia is grappling with a challenging economic situation due to sanctions, attempting to effectively manage its resources, particularly its oil reserves, in order to balance its budget.
As trade interactions between the European Union and Russia continue to decline and Russia’s foreign reserves erode due to sanctions, the ongoing global strengthening of the US dollar appears to make a rise in the USD/RUB pair almost inevitable.
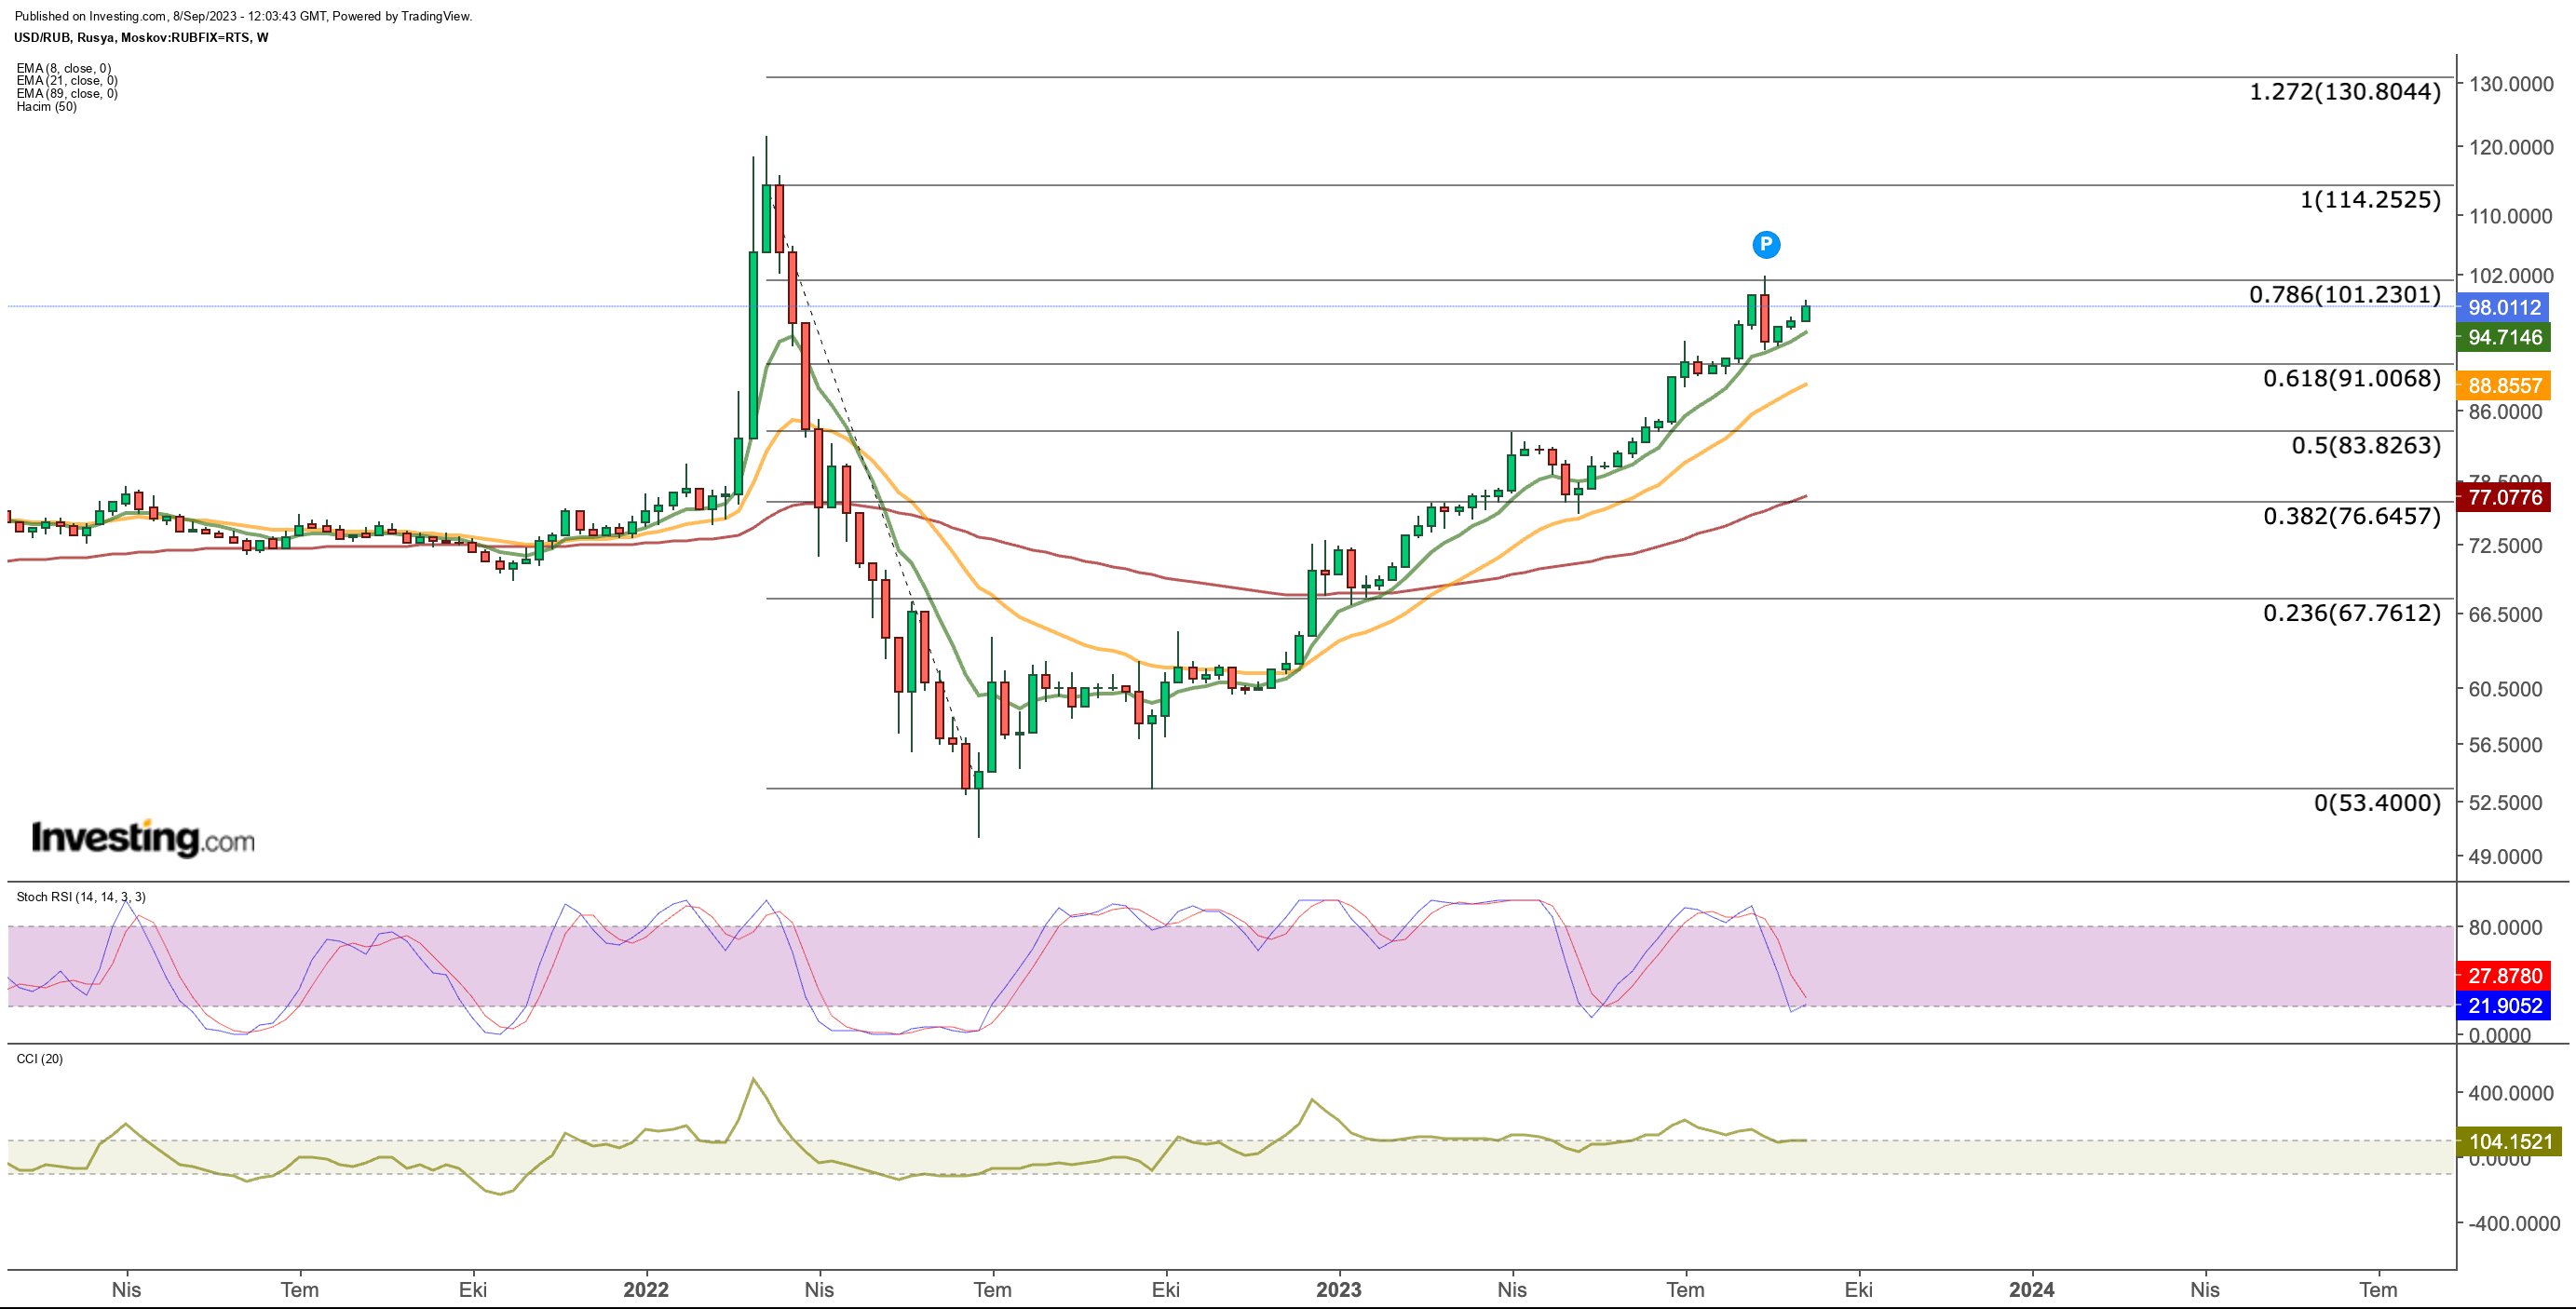
From a technical perspective, USD/RUB experienced a partial decline to the 92 level after reaching 101 within a long-term uptrend. However, in the last three weeks, the pair has rebounded and moved back towards the 100 level.
Considering the ongoing issues in Russia and the strong position of the US dollar, it is plausible that the USD/RUB pair’s upward momentum may persist, with the potential for the pair to reach the March 2022 peak at 115 after breaking the resistance at 101 (Fib 0.786).
However, if there is a sign of dollar weakness following a possible intervention around the 100-101 level, a retracement of USD/RUB towards the 88-91 level may become possible.
Nevertheless, from a technical standpoint, the prevailing trend suggests an upward movement is more likely than a correction.
***

Find All the Info you Need on InvestingPro!
Disclosure: The author holds no position in any of the instruments mentioned in this report.


