War for Semiconductor Supremacy Rages On: Which Company Will Come Out on Top?
2023.06.01 10:52
- Escalating U.S.-China trade war is focused on the semiconductor industry
- Both countries are looking to ramp up investments in mass production of semiconductors
- Amid the geopolitical standoff, one of these three companies could come out on top
Last year was defined by a growing trade war between the United States and China centered around semiconductors. These tiny but crucial components, often referred to as the “oil of the 21st century,” play a vital role in producing electronic devices that have become an integral part of our daily lives, ranging from simple calculators to powerful computers.
With the rise of artificial intelligence, the demand for integrated circuits, chips, and advanced electronics is expected to skyrocket. This trend has caught the attention of governments worldwide, as they recognize the strategic importance of these technologies.
So, how will companies leading the global semiconductor production fare in the race to mass-produce semiconductors?
Using InvestingPro tools, Let’s analyze which companies can be considered for your portfolio as the trade war unfolds.
You can do so for virtually any stock by clicking on the following link: Start picking stocks today!
Taiwan Semiconductor Manufacturing
One of the basic metrics in chip manufacturing is nanometers-in simple terms, the smaller, the better. Taiwan Semiconductor Manufacturing (NYSE:) is the world’s leading manufacturer of 5-nanometer chips, but it also produces 3-nanometer, 4-nanometer, and will soon produce 2-nanometer chips.
The company employs more than 50,000 people and produces more than 10 million semiconductor products annually. Although the first quarter of this year was slightly weaker than the previous quarter (typical for the company over the past few years), revenue and net profits have remained stable.

TSMC Revenue Trend
Source: InvestingPro
InvestingPro includes a profile summary that lists the fundamental characteristics of a company. For TSMC, the positive characteristics outweigh the negative ones.

TSM Company Profile
Source: InvestingPro
Geopolitical risk poses a significant threat to TSMC’s business, particularly due to potential Chinese aggression. The United States has taken a firm stance in defending the island, creating a potential flashpoint for future conflict.
This situation adds uncertainty and challenges to the company’s operations and growth prospects.
Samsung Electronics
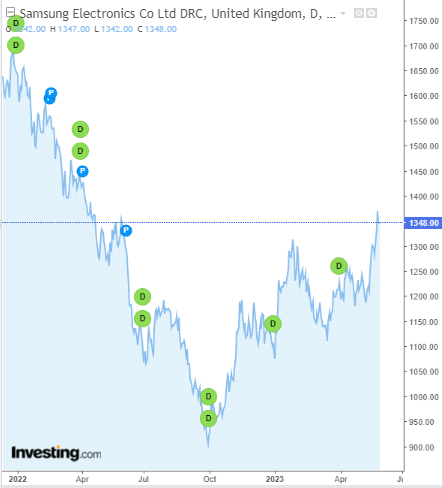
Samsung Electronics (LON:) faced challenges in the first quarter of 2023 due to demand issues, resulting in the company’s lowest operating profit since 2009 at $455 million.
Surprisingly, the company’s stock did not lose much. Instead, it has continued its uptrend as it approaches the next milestone at $1400.

Trwa wojna o półprzewodniki. Które spółki mogą być największymi wygranymi?
However, the stock still has more room to rally, according to InvestingPro. Its fair value is estimated at around $1660-1670 per share.

Samsung Fair Value
Source: InvestingPro
The persistence of growth despite weak quarterly results highlights investors’ high hopes for this sector. It is widely regarded as one of the most promising industries in the years to come.
Qualcomm
Qualcomm (NASDAQ:), a global semiconductor manufacturer, supplies chips to a wide range of customers spanning from watches to powerful PC servers. A highly anticipated event this year is the launch of the new Snapdragon 8+ Gen 3 processor, following the release of Generation 2.
Prominent phone manufacturers Xiaomi and Oppo eagerly await this launch. However, there could be potential geopolitical risks associated with partnering with these leading manufacturers from China.
From a technical perspective, the company’s stock price has shown a strong recovery near the recent lows of around $102, indicating a double-bottom formation.

Qualcomm Daily Chart
Buyers may face a supply zone near $125, but a rally toward this year’s peak price of $140 per share is always possible.
InvestingPro tools assist savvy investors analyze stocks, like we did in this article. By combining Wall Street analyst insights with comprehensive valuation models, investors can make informed decisions while maximizing their returns.
Start your InvestingPro free 7-day trial now!

Find All the Info you Need on InvestingPro!
Disclaimer: This article is written for informational purposes only; it does not constitute a solicitation, offer, advice, counseling, or recommendation to invest as such it is not intended to incentivize the purchase of assets in any way. I would like to remind you that any type of asset, is evaluated from multiple points of view and is highly risky and therefore, any investment decision and the associated risk remain with the investor.


