Volatile food prices led to India cenbank missing inflation forecasts – economists
2022.10.13 05:31
[ad_1]

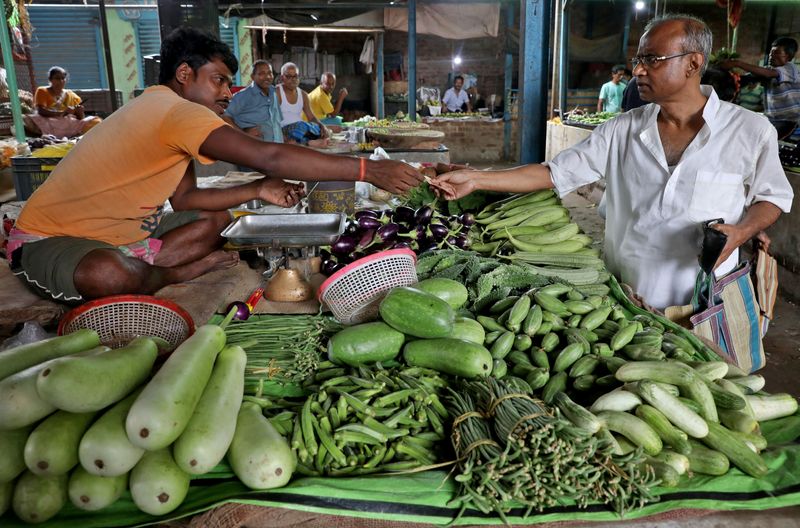
© Reuters. FILE PHOTO: Nikhil Kumar Mondal, 65, a retired school headmaster, buys vegetables from a vendor at a market on the outskirts of Kolkata, India, May 20, 2022. Picture taken May 20, 2022. REUTERS/Rupak De Chowdhuri
By Anushka Trivedi
MUMBAI (Reuters) – India’s central bank has been consistently missing its inflation projections over the last two and half years mainly due to extreme weather conditions that drove up food prices, economists said on Thursday.
Inflation has been above the RBI’s quarterly projections in the bi-annual monetary policy report (MPR) in eight out of the last 10 quarters until September, while retail price rise exceeded the 4%-6% mandated target band since January.
RBI’s inflation projections in the MPR are based on its economic model but the extreme weather conditions have made food price volatility hard to predict, said economists.
Graphic: India cenbank’s CPI projections vs actual outcomes
“There are extreme weather conditions globally and domestically, which is really causing a lot of volatility to perishable food items,” said Upasna Bhardwaj, senior economist at Kotak Mahindra Bank.
“So, to that extent, it is becoming increasingly difficult to capture food inflation beyond immediate near-term.”
“Particularly in India, monsoon has a role to play. If rice producing states don’t receive up to the mark rainfall, it can cause inflation to grow…and those are hard things to predict,” said Disha Sahgal, an economist and country risk manager with ANZ.
India’s retail inflation accelerated in September to a five-month high of 7.41%, data showed on Wednesday, as annual food prices surged to a two-year high of 8.60%, on the back of continually growing cereal prices.
However, the RBI’s monetary policy committee does take into account near-term price pressures when it announces its quarterly projections, and the revised projections by the MPC have been closer to actual numbers due to constant revisions.
“War-induced price pressures as well as domestic supply shocks turned out to be stronger and more persistent than anticipated, resulting in actual inflation exceeding projections by around 100 bps each in Q1 and Q2 (of FY23),” the RBI said in its latest MPR published on Sept. 30.
It added that a large part of the surprise increase came from food inflation due to global factors, while heat wave and depreciation in the rupee were also responsible for the projection errors.
Graphic: Components of Indian inflation
In the past two years, black swan events like the COVID-19 pandemic and the Ukraine-Russia war had overall made mathematical forecasting difficult, resulting in actual inflation overshooting the prediction, economists said.
The extreme volatility has raised the need for a rejig of inflation modelling.
There are multiple models that can factor in volatility like the ones seen in food prices this year, Kotak’s Bhardwaj said.
“But at some point, a reworking may be required to make them more dynamic.”
[ad_2]
Source link


