USD/TRY on the Brink of High-Velocity Range Breakout: Keep an Eye on This Buy Zone
2024.07.25 08:00
- The Turkish Lira has shown resilience against the US Dollar, trading near the 33 level.
- Factors such as the Central Bank of Turkey’s tightening policy and Moody’s credit rating upgrade have bolstered the Lira.
- Currently, USD/TRY is on the verge of breaking out of a trading range.
- Unlock AI-powered Stock Picks for Under $8/Month: Summer Sale Starts Now!
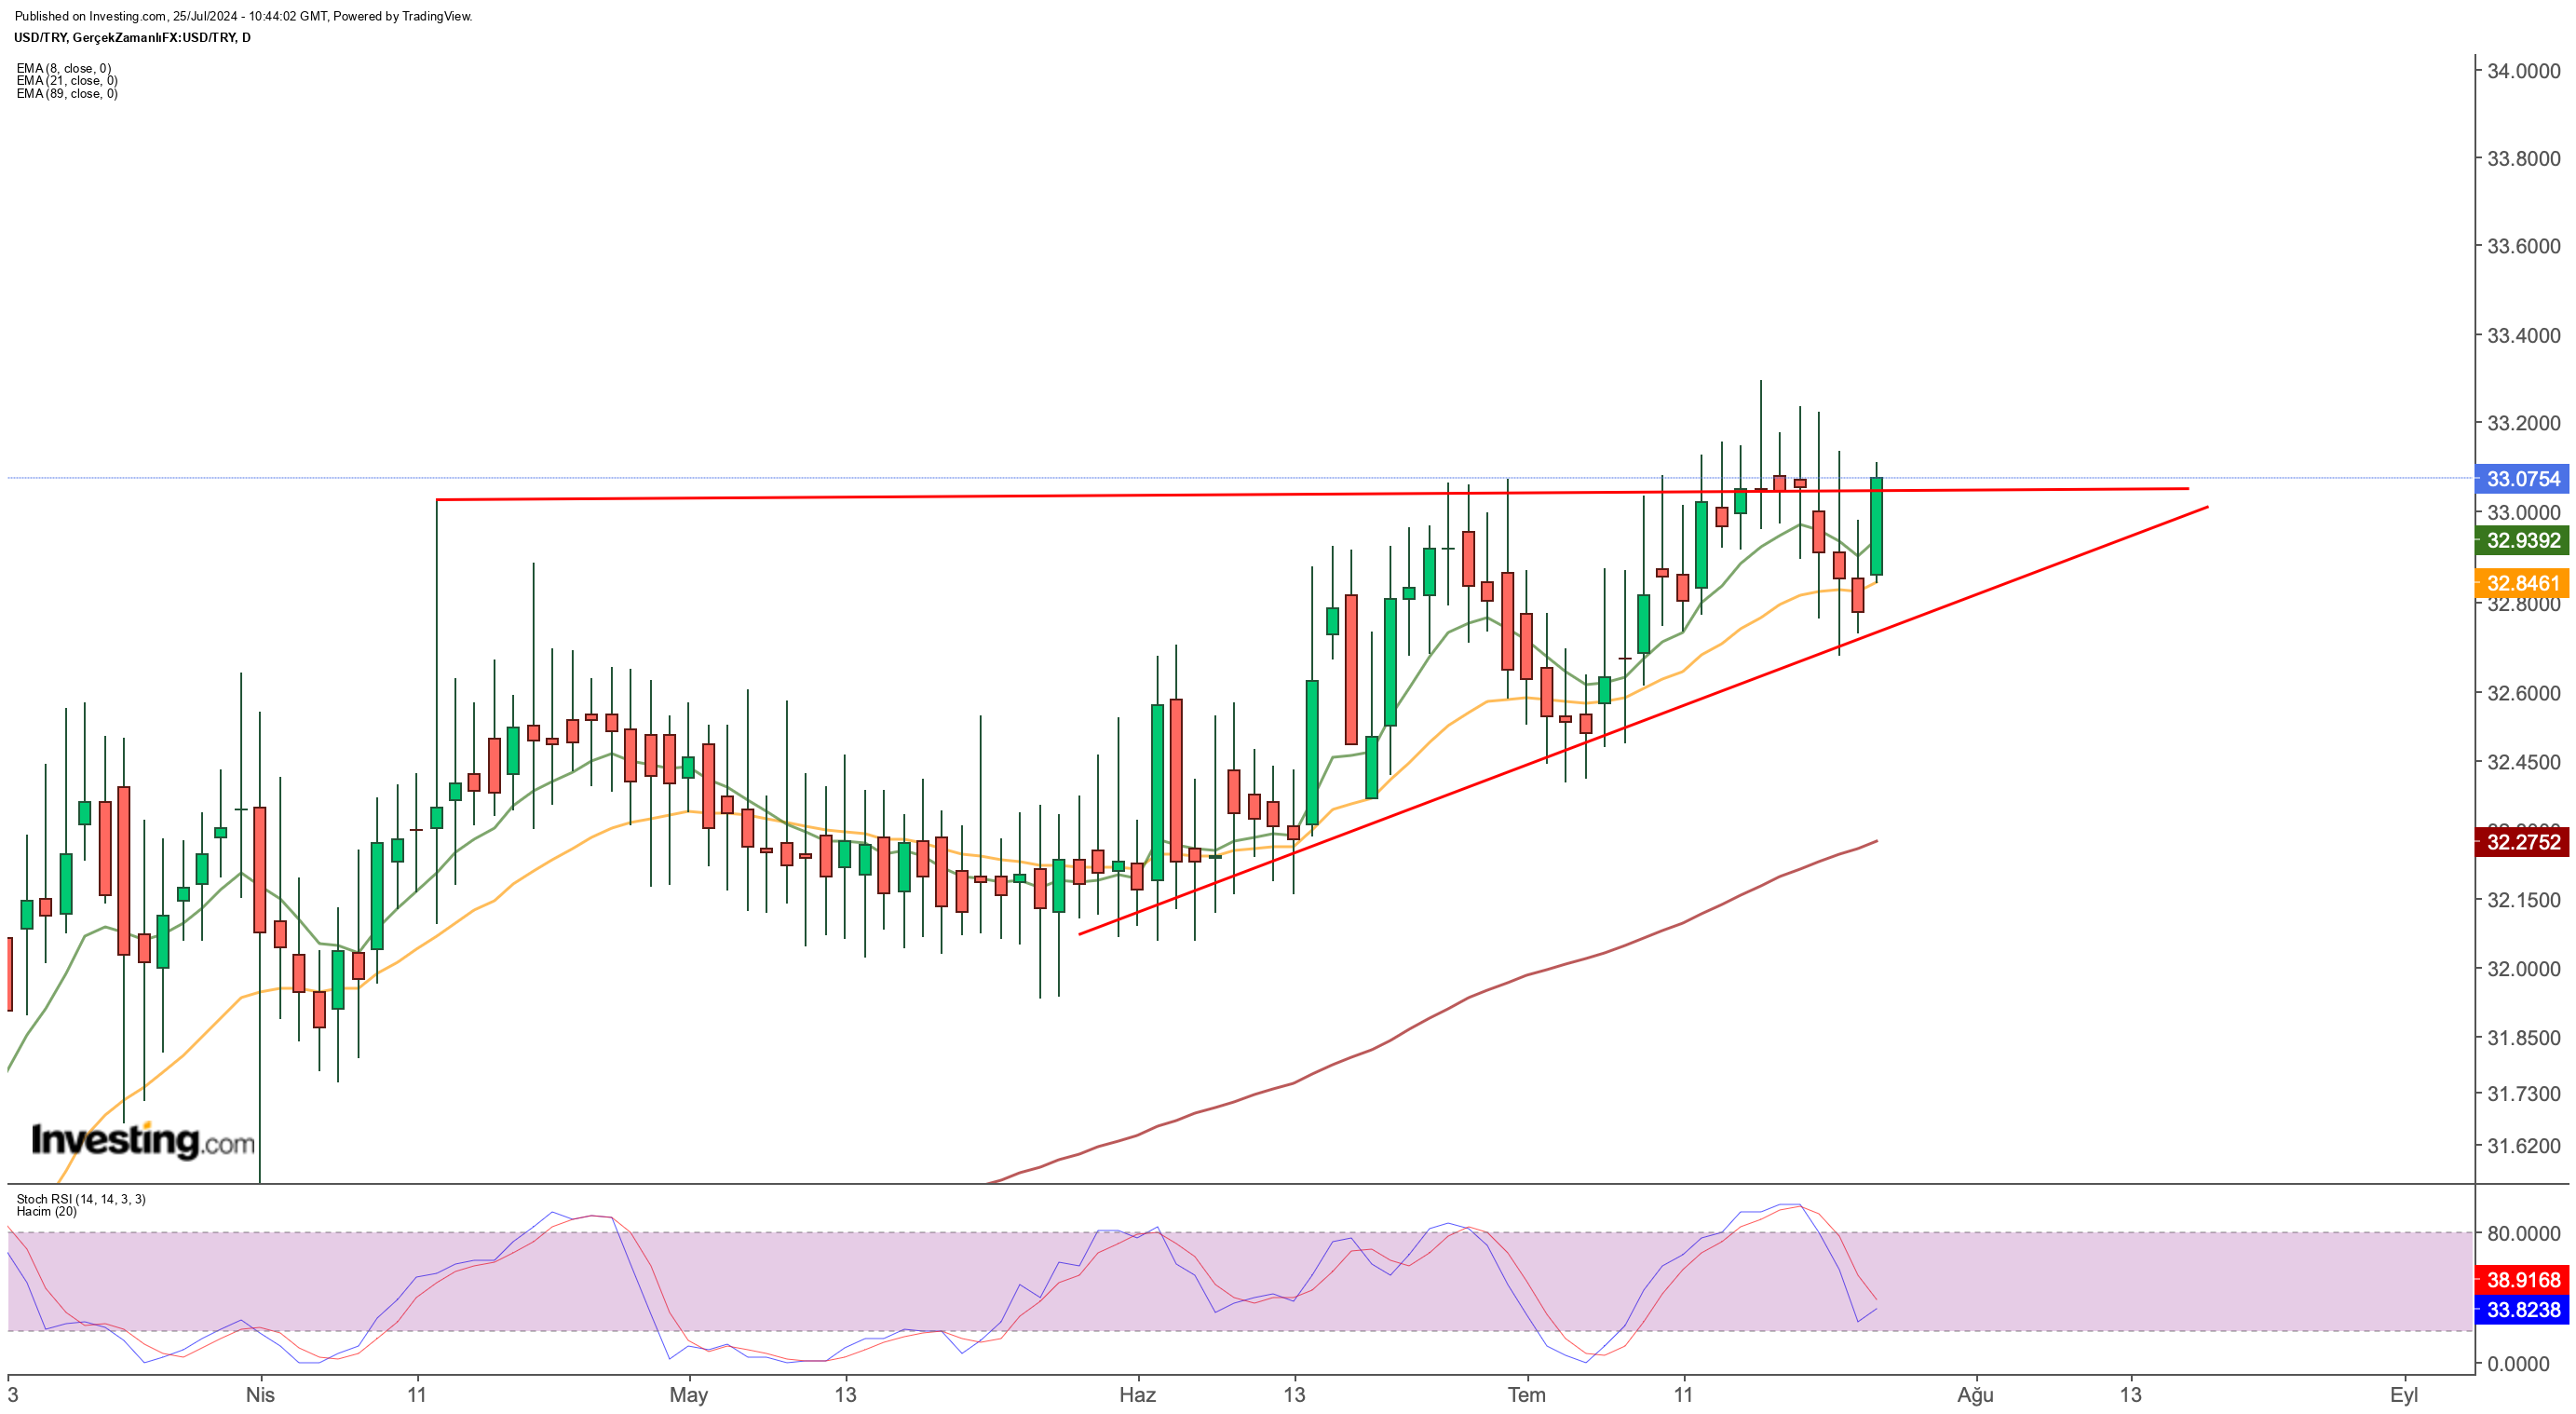
The has shown resilience against the in recent weeks, trading near the 33 level. While the pair briefly touched 32.78, a potential support level, it quickly rebounded, indicating a growing strength for the Lira.
The recent stability of the USD/TRY pair can be attributed to several factors. The Central Bank of Turkey’s (CBRT) tightening monetary policy and Moody’s (NYSE:) credit rating upgrade have boosted investor confidence in the Lira. Additionally, the normalization of swap market conditions has contributed to the currency’s resilience.
However, the Lira’s gains are tempered by decreasing risk appetite in global markets and the potential for further tightening by the Bank of Japan. The latter could exacerbate selling pressure on emerging market currencies, including the Lira.
Despite these headwinds, the Lira’s appreciation against inflation and the ongoing efforts to reduce government spending suggest a potential for further strengthening. Yet, the CBRT’s high-interest rate policy and fiscal austerity measures continue to weigh on economic growth, limiting the pace of Lira appreciation.
Ultimately, the USD/TRY pair is caught between bullish and bearish forces. While the Lira has shown resilience, breaking below the 32.7 support level could signal renewed weakness. Conversely, a sustained break above the 33 resistance level would indicate a stronger trend reversal.
Investors should closely monitor global risk sentiment, the CBRT’s monetary policy stance, and the evolving dynamics between the US and Japanese economies to assess the outlook for the Turkish Lira.
USD/TRY Technical Outlook: Rangebound with Upward Bias
USD/TRY is currently trading within a tight range, bounded by resistance at 33.10 and support around 32.85.

The pair has formed higher lows in recent sessions, suggesting a potential upward bias. A decisive break above 33.10 could open the way for a move towards 33.30-33.70.
Conversely, a sustained break below 32.85 would invalidate the bullish scenario and increase the likelihood of a deeper correction towards the 32.20 level.
Increased volatility is expected as the pair attempts to break out of the current range. Traders should closely monitor price action and technical indicators for clues about the next directional move.
***
This summer, get exclusive discounts on our subscriptions, including annual plans for less than $8 a month!
Tired of watching the big players rake in profits while you’re left on the sidelines?
InvestingPro’s revolutionary AI tool, ProPicks, puts the power of Wall Street’s secret weapon – AI-powered stock selection – at YOUR fingertips!
Don’t miss this limited-time offer.
Subscribe to InvestingPro today and take your investing game to the next level!

Disclaimer: This article is written for informational purposes only; it does not constitute a solicitation, offer, advice, counsel or recommendation to invest as such it is not intended to incentivize the purchase of assets in any way. I would like to remind you that any type of asset, is evaluated from multiple perspectives and is highly risky and therefore, any investment decision and the associated risk remains with the investor.


