US second-quarter economic growth revised lower as inventories drop
2023.08.30 11:15

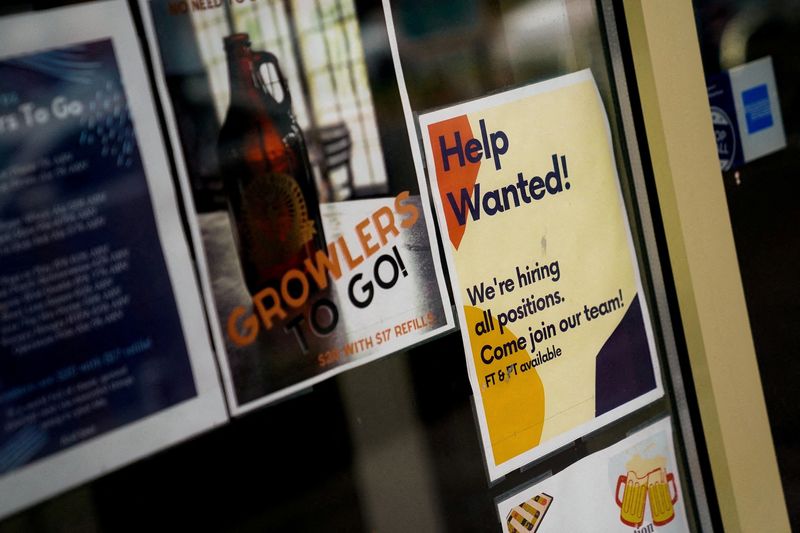
© Reuters. FILE PHOTO: An employee hiring sign is seen in a window of a business in Arlington, Virginia, U.S., April 7, 2023. REUTERS/Elizabeth Frantz/File Photo
By Lucia Mutikani
WASHINGTON (Reuters) -The U.S. economy grew at a slightly less brisk pace than initially thought in the second quarter as businesses liquidated inventory, but momentum appears to have picked up early this quarter as a tight labor market underpins consumer spending.
The report from the Commerce Department on Wednesday also confirmed that inflation pressures moderated last quarter. The economy continues to expand despite 525 basis points worth of interest rate hikes from the Federal Reserve since March 2022.
“The details of the report continue to point to an economy with positive underlying momentum and that demonstrated resilience in the face of elevated interest rates, tighter credit conditions and a weak global backdrop,” said Lydia Boussour, a senior economist at EY-Parthenon in New York.
Gross domestic product increased at a 2.1% annualized rate last quarter, the government said in its second estimate of GDP for the April-June period. That was revised down from the 2.4% pace reported last month. Economists polled by Reuters had expected GDP for the second quarter would be unrevised.
Inventory investment was sharply revised down to show it declining at a $1.8 billion pace instead of increasing at the previously reported $9.3 billion rate. Inventories were a small drag to GDP growth instead of adding 0.14 percentage point as estimated last month.
There were also downward revisions to business spending on equipment and intellectual products. These offset a slight upgrade to consumer spending, which accounts for more than two-thirds of U.S. economic activity.
The economy grew at a 2.0% pace in the first quarter. It is expanding at a pace well above what Fed officials regard as the non-inflationary growth rate of around 1.8%.
The economy’s resilience raises the risk of borrowing costs remaining higher for a while, but slowing inflation is fueling optimism that the U.S. central bank is probably done hiking rates and could engineer a “soft landing.” Most economists have walked back their forecasts for a recession this year.
INFLATION COOLING
The government’s measure of inflation in the economy, the price index for gross domestic purchases, rose at a 1.7% rate, revised down from the 1.9% rate estimated last month. This followed a 3.8% pace of increase in the first quarter.
The personal consumption expenditures price index (PCE) excluding food and energy advanced at a 3.7% rate, lowered from the previously reported 3.8% pace. That was a sharp slowdown from the 4.9% pace logged in the January-March quarter. The Fed watches the PCE price indexes for monetary policy.
Though the labor market is slowing – the ADP National Employment Report showed on Wednesday that private payrolls rose by 177,000 jobs in August after increasing by 371,000 in July – conditions remain tight as employers hang on to their workers after hiring difficulties during the COVID-19 pandemic.
That is keeping wage growth elevated, helping to drive consumer spending. Retail sales increased strongly in July, while single-family homebuilding was robust.
Economists have boosted their third-quarter growth estimates to as high as a 5.9% rate, but this likely overstates the health of the economy.
An alternative measure of growth, gross domestic income, or GDI, rebounded at a 0.5% rate in the second quarter. GDI, which measures the economy’s performance from the income side, contracted at a 1.8% pace in the first quarter.
In principle, GDP and GDI should be equal, but in practice differ, as they are estimated using different and largely independent source data.
The average of GDP and GDI, also referred to as gross domestic output and considered a better measure of economic activity, increased at a 1.3% rate in the April-June period, up from a 0.1% growth pace in the first quarter.
The income side of the growth ledger was supported by a rebound in corporate profits.
National after-tax profits without inventory valuation and capital consumption adjustments, conceptually most similar to profits, increased $67.6 billion in the second quarter, or at a 2.5% pace, after declining at a 1.2% rate in the January-March period. Profits were down 9.4% from a year ago.


