US Dollar Sinks in November: Can Greenback Find Support Before 2023 Ends?
2023.12.04 06:54
- November brought a correction to the Dollar Index, and eventually, it found stability around the 103 level.
- EUR/USD on the other hand is awaiting signals from Lagarde’s speech to determine next direction.
- Meanwhile, gold has retreated slightly after a bull run toward all-time highs.
- Missed out on Black Friday? Secure your up to 60% discount on InvestingPro subscriptions with our extended Cyber Monday sale.
In November, the experienced a correction as bullish momentum waned. The greenback eventually breached the range between 105 and 107 that had persisted throughout October.
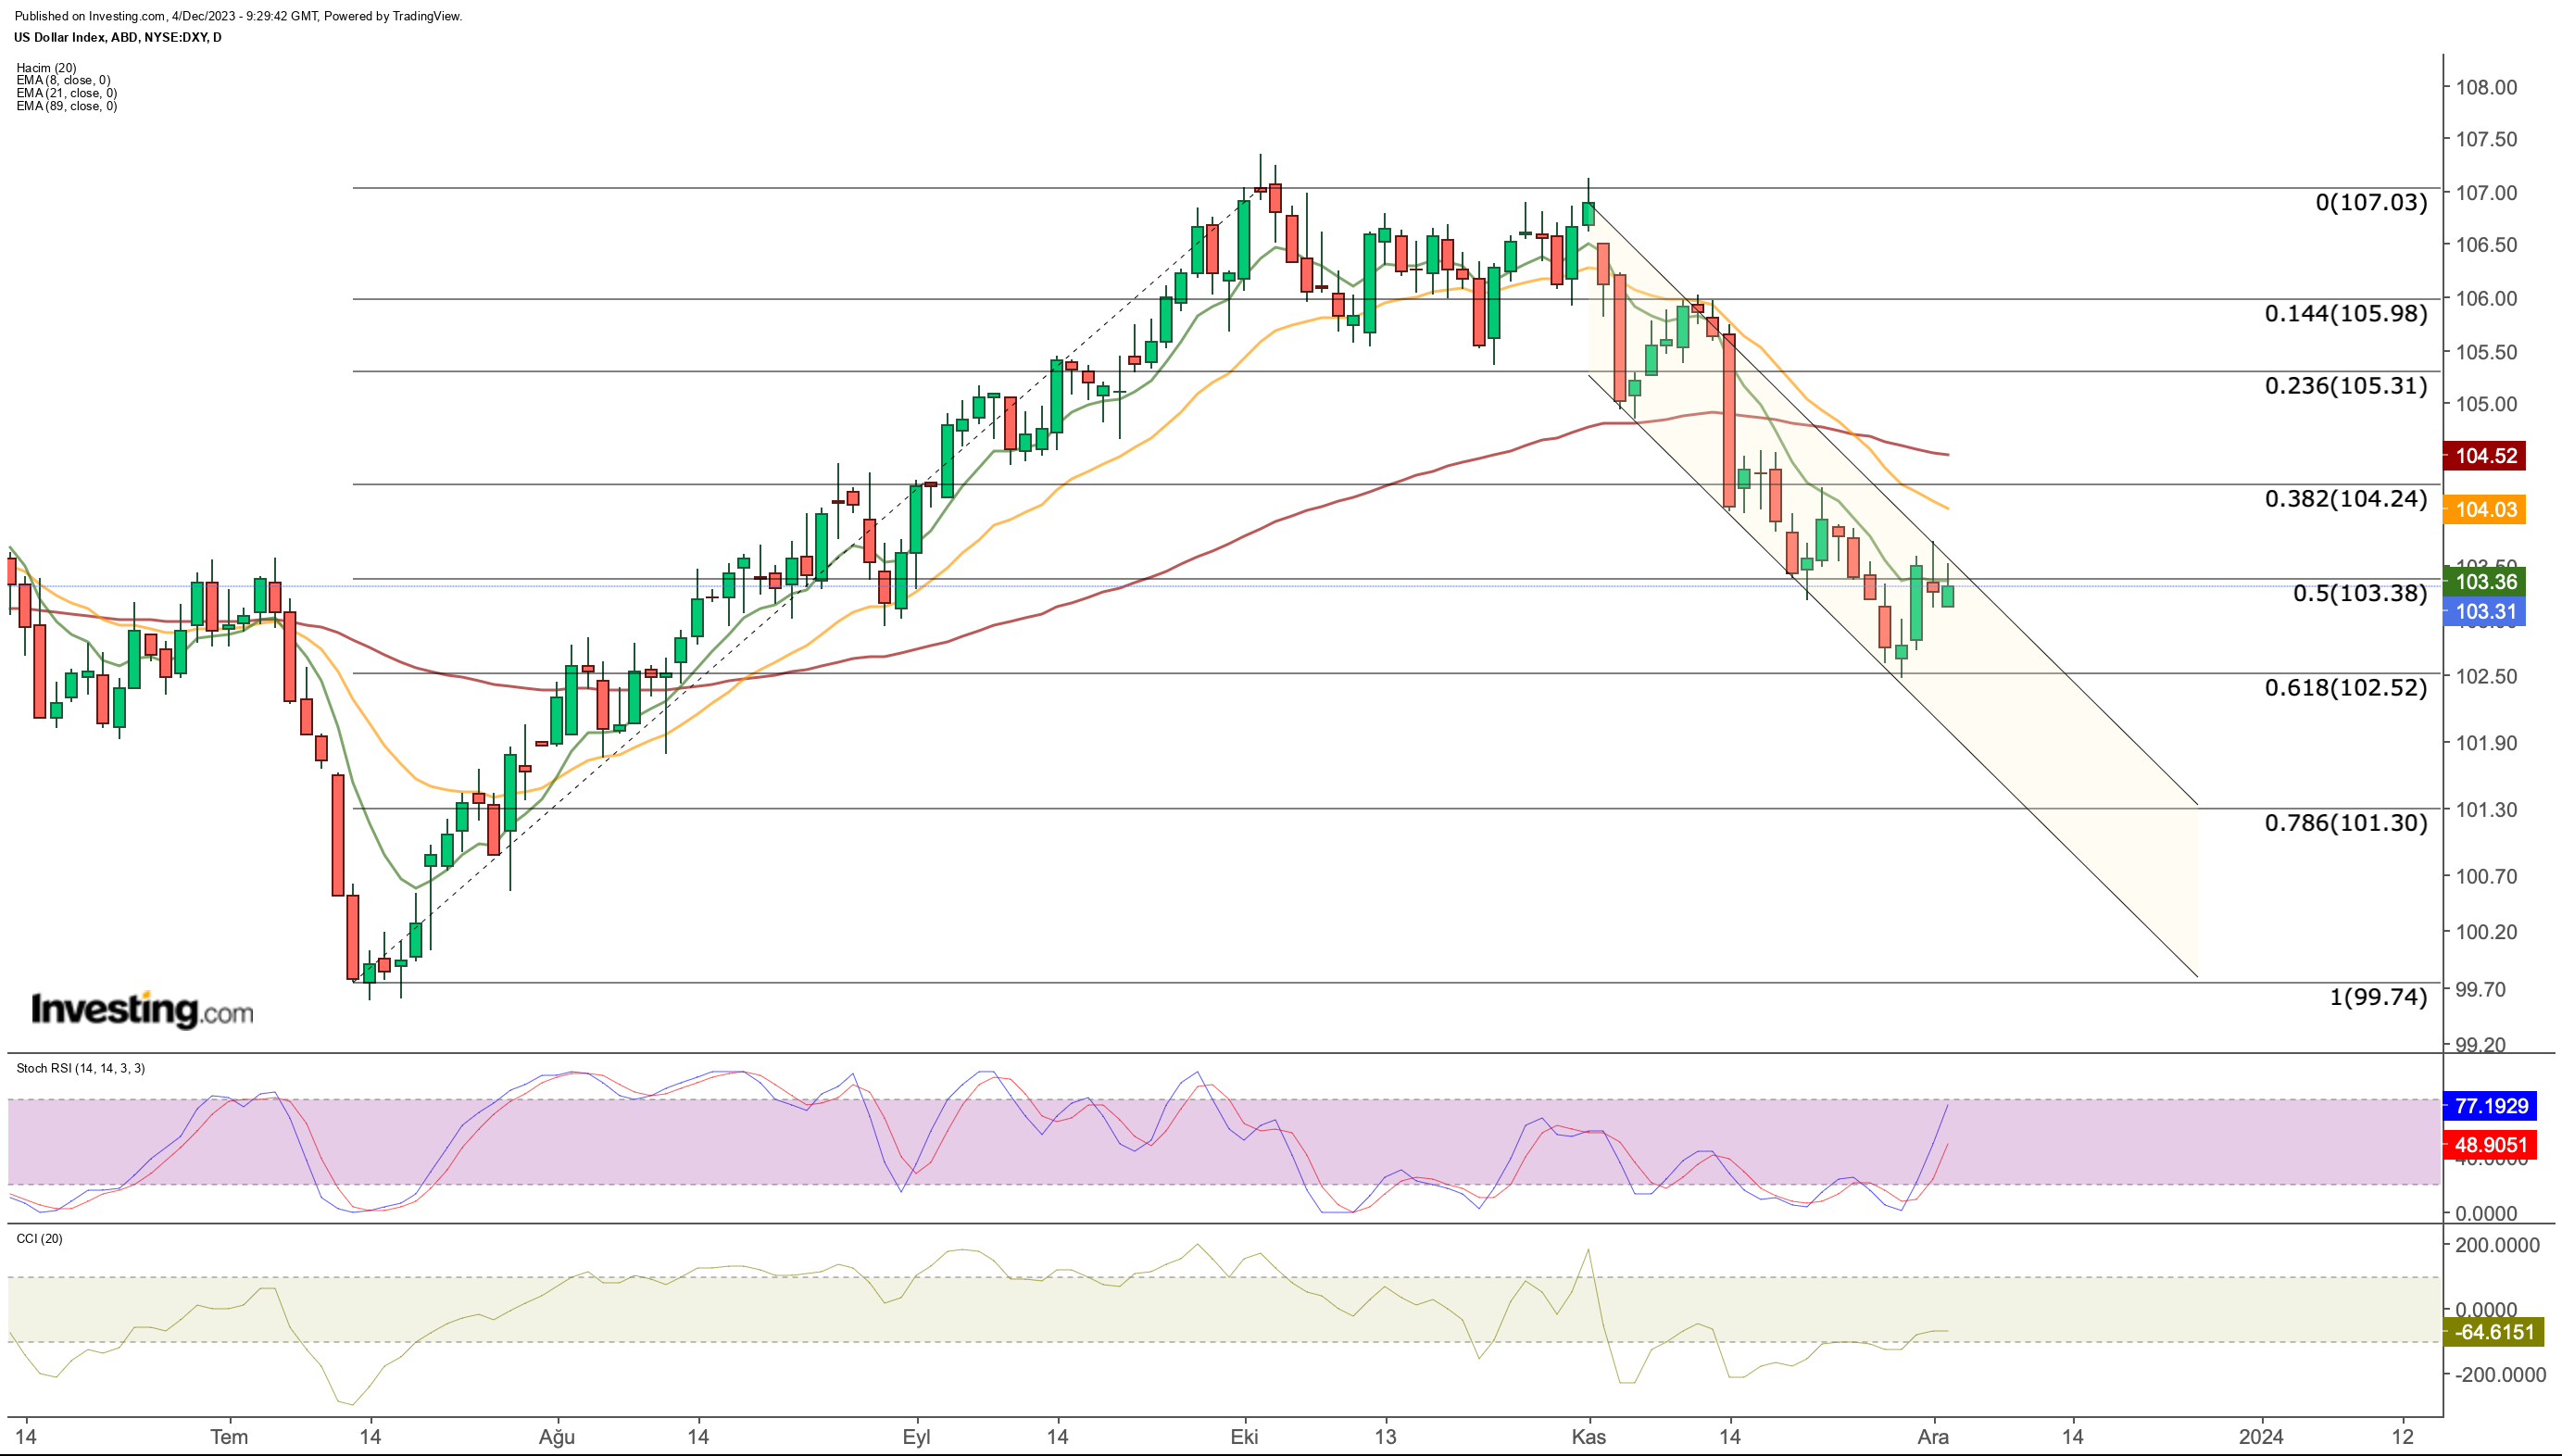
Finding a balance around the 103 levels, the DXY rebounded marginally from a crucial support zone, recuperating from a nearly 4% dip in the previous month.
Analyzing the daily chart, the DXY experienced a descent below its pivotal support at an average of 105.3.
The downward trajectory extended to the Fibonacci 0.618 level relative to the recent uptrend, witnessing a substantial rebound at this juncture, which aligns with an average of 102.5.
While acknowledging reactions at other Fibonacci retracement levels corresponding to 104.2 and 103.4 during the November downturn, the most decisive response emerged at the Fib 0.618 level.
Despite this, the overall trend appears to maintain a bearish stance. The Dollar Index, recovering from 102.5, is currently encountering resistance at 103.4, coupled with its 8-day EMA value, shaping this level as a dynamic barrier.

For a recovery in the dollar, the 103 region needs to be decisively crossed this week. Although a rebound at this point has the potential to carry the dollar index up to the 104.5 region, the index may encounter stiffer resistance at the 104.5 level and turn its direction down again.
On the other hand, the current trend remains valid that the weakening of the dollar may continue. This means that it will be difficult to break through the 103 band, while the DXY is more likely to test the 102.5 support once again. A possible breakout will accelerate the downtrend and we can see that the dollar may continue to weaken towards the 101 region.
On the last working day of last week, Powell’s were interpreted as cautious. While Powell acknowledged that the policy has slowed down the economy, he said that interest rates have reached the restrictive zone. Despite reiterating the possibility of a hike if necessary, the market is firmly convinced that the interest rate hike cycle is over.
Economic data to be released this week will provide important signals about the US economy. The data on Wednesday will be closely monitored as a leading indicator before the data to be released on Friday. In addition, and data to be announced throughout the week may be decisive on the course of the dollar index.
The employment report to be released on Friday will be closely monitored as it will be key for the Fed’s interest rate decision to be announced on December 13.
EUR/USD: Lagarde’s Message Key for Next Direction
In its recovery trend against the dollar, the fell to the 1.085 band when it faced a sharp reaction at the 1.1 dollar level last week.

The reason for this decline can be attributed to the 2.4% decline in November inflation last week and the ECB’s rhetoric that the ECB may cut its interest rates faster than expected. Therefore, ECB President ‘s speech today has become more important for the course of the Euro. Lagarde’s signals on the interest rate situation before the data coming from the Eurozone this week can be priced on the Euro side.
When we look at the EUR/USD chart, it is seen that the pair finds support at the level of 1.085 in the short term, while decisive messages from the ECB may cause the Euro to continue to increase in value against the dollar. Technically, the average value of 1.096 stands out as the first resistance point. Above this price, we can see that the trend may settle in the range of 1.10 – 1.12 before the new year. In the lower zone, below 1.085, the 1.076 level may appear as a more solid support for the moment.
Gold Retreats: Support at $2070 Needs to Hold to Target $2200
Last week, investors in search of yield turned to as geopolitical risks rose again with the end of the ceasefire and weakening demand for the dollar.

With the increasing expectation that the interest rate cut could be made earlier, investors in search of alternative yields wanted to take a quick position before the new year, while demand for gold began to increase.
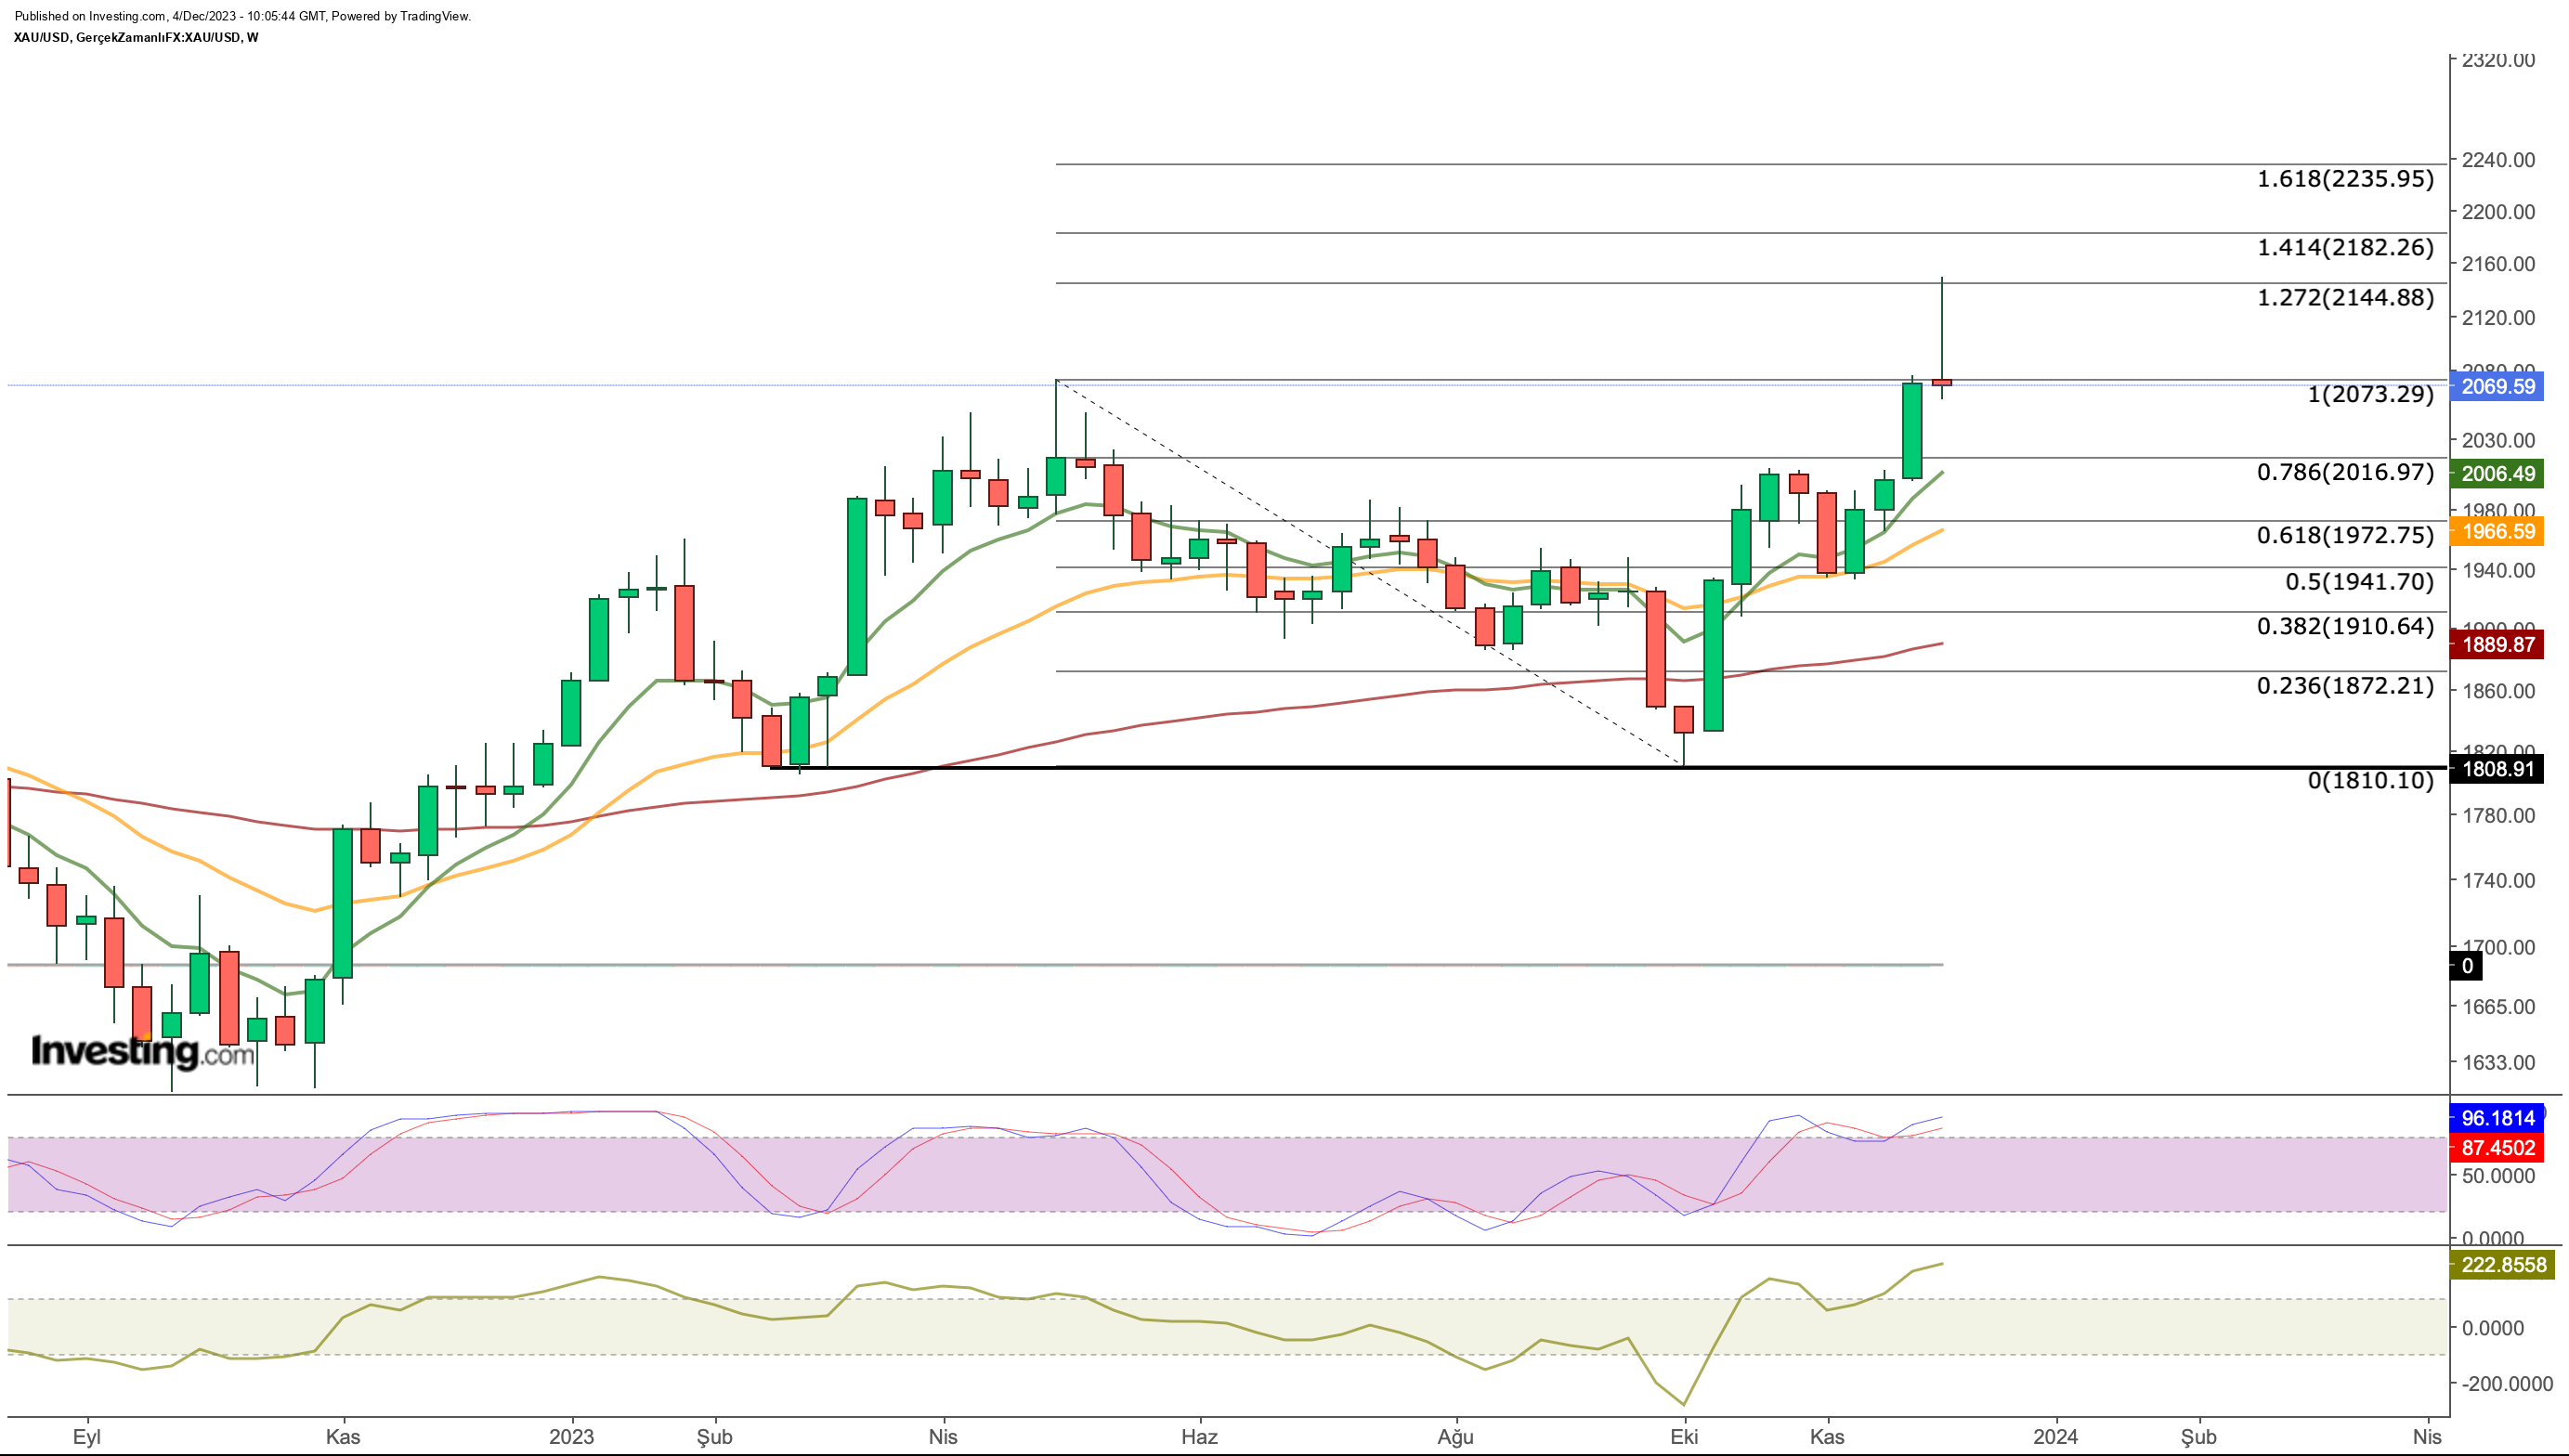
Gold, which turned its direction upwards in October with the start of the clashes between Israel and Hamas, saw a partial correction in the first half of November with some decrease in geopolitical risk and broke a new record by rising to $ 2,150 before Asian trading hours today with support from the $ 1,930 band. The yellow metal quickly retreated from its peak level as the new week began, showing volatility at the beginning of the week, falling as low as $ 2,060.
From a broader perspective, gold seems to have returned to its last peak in May. Accordingly, if the support of $ 2,070 is maintained, we can see that the gap up to $ 2,150 can be filled during the week. If the weekly close comes above $ 2,150, we can see that gold can move towards the $ 2,180 and then $ 2,200 band until the end of the year.
If the support of $ 2,070 cannot be maintained after the rapid retreat, this time ounce of gold may be likely to see a correction towards the $ 2,010 band during the week. For the gold market, the geopolitical situation and economic data from the US that may affect the interest rate outlook will be closely monitored throughout the week.
***
You can easily determine whether a company is suitable for your risk profile by conducting a detailed fundamental analysis on InvestingPro according to your own criteria. This way, you will get highly professional help in shaping your portfolio.
In addition, you can sign up for InvestingPro, one of the most comprehensive platforms in the market for portfolio management and fundamental analysis, much cheaper with the biggest discount of the year (up to 60%), by taking advantage of our extended Cyber Monday deal.

Claim Your Discount Today!
Disclaimer: This article is written for informational purposes only; it does not constitute a solicitation, offer, advice, or recommendation to invest as such it is not intended to incentivize the purchase of assets in any way. I would like to remind you that any type of asset, is evaluated from multiple points of view and is highly risky and therefore, any investment decision and the associated risk remains with the investor


