US Dollar Nears Crucial Support Level Post-Fed: What’s Next for the Greenback?
2023.11.02 09:27
- Recent market focus has shifted from geopolitical issues to economic data
- The US dollar declined slightly following Fed’s decision to leave interest rates unchanged
- Meanwhile, the EUR/USD has continued to recover against the dollar
In recent days, the financial markets have witnessed a shift in focus, moving from geopolitical concerns to economic data, largely due to a waning Middle East news flow.
Geopolitical tensions still loom large as a substantial risk to the global economy. Escalating energy costs, particularly in nations grappling with high inflation, complicate the efficacy of monetary policies employed by central banks. Given this context, the made during the recent US Fed’s FOMC meeting is significant for the US economic trajectory.
While the Fed, in line with expectations, opted to leave interest rates unchanged within the range of 5.25% to 5.50% this month, there’s a growing market sentiment that the peak interest rate has been reached, marking the start of a forthcoming period of rate adjustments. Moreover, the acknowledged rapid economic growth in the last quarter alongside persistent high inflation. Notably, it highlighted the cost pressures stemming from higher interest rates, which could impact employment and inflation.
Within this framework, the central bank underscored its commitment to employ monetary policy tools effectively to address heightened risks of deviating from the inflation target. Chairman Powell emphasized that future decisions would hinge on economic data and clarified that interest rate cuts are not currently on their agenda.
Against this backdrop, the release of tomorrow and October’s data will serve as pivotal indicators for assessing whether the Fed will proceed with a rate hike in December.
US Dollar Eases Slightly Following Fed Decision
Meanwhile, the has maintained a sideways trajectory, experiencing minor declines amid the perception that interest rates have peaked. This holding pattern for the has provided some respite for riskier currencies and the stock market. It’s worth noting that remains a significant barometer for risk assets, sustaining a positive outlook and recently approaching the $36,000 mark.
As a result, discussions regarding Fed rhetoric have shifted from debates about the duration of the rate hike to a more balanced and cautious stance at the moment.
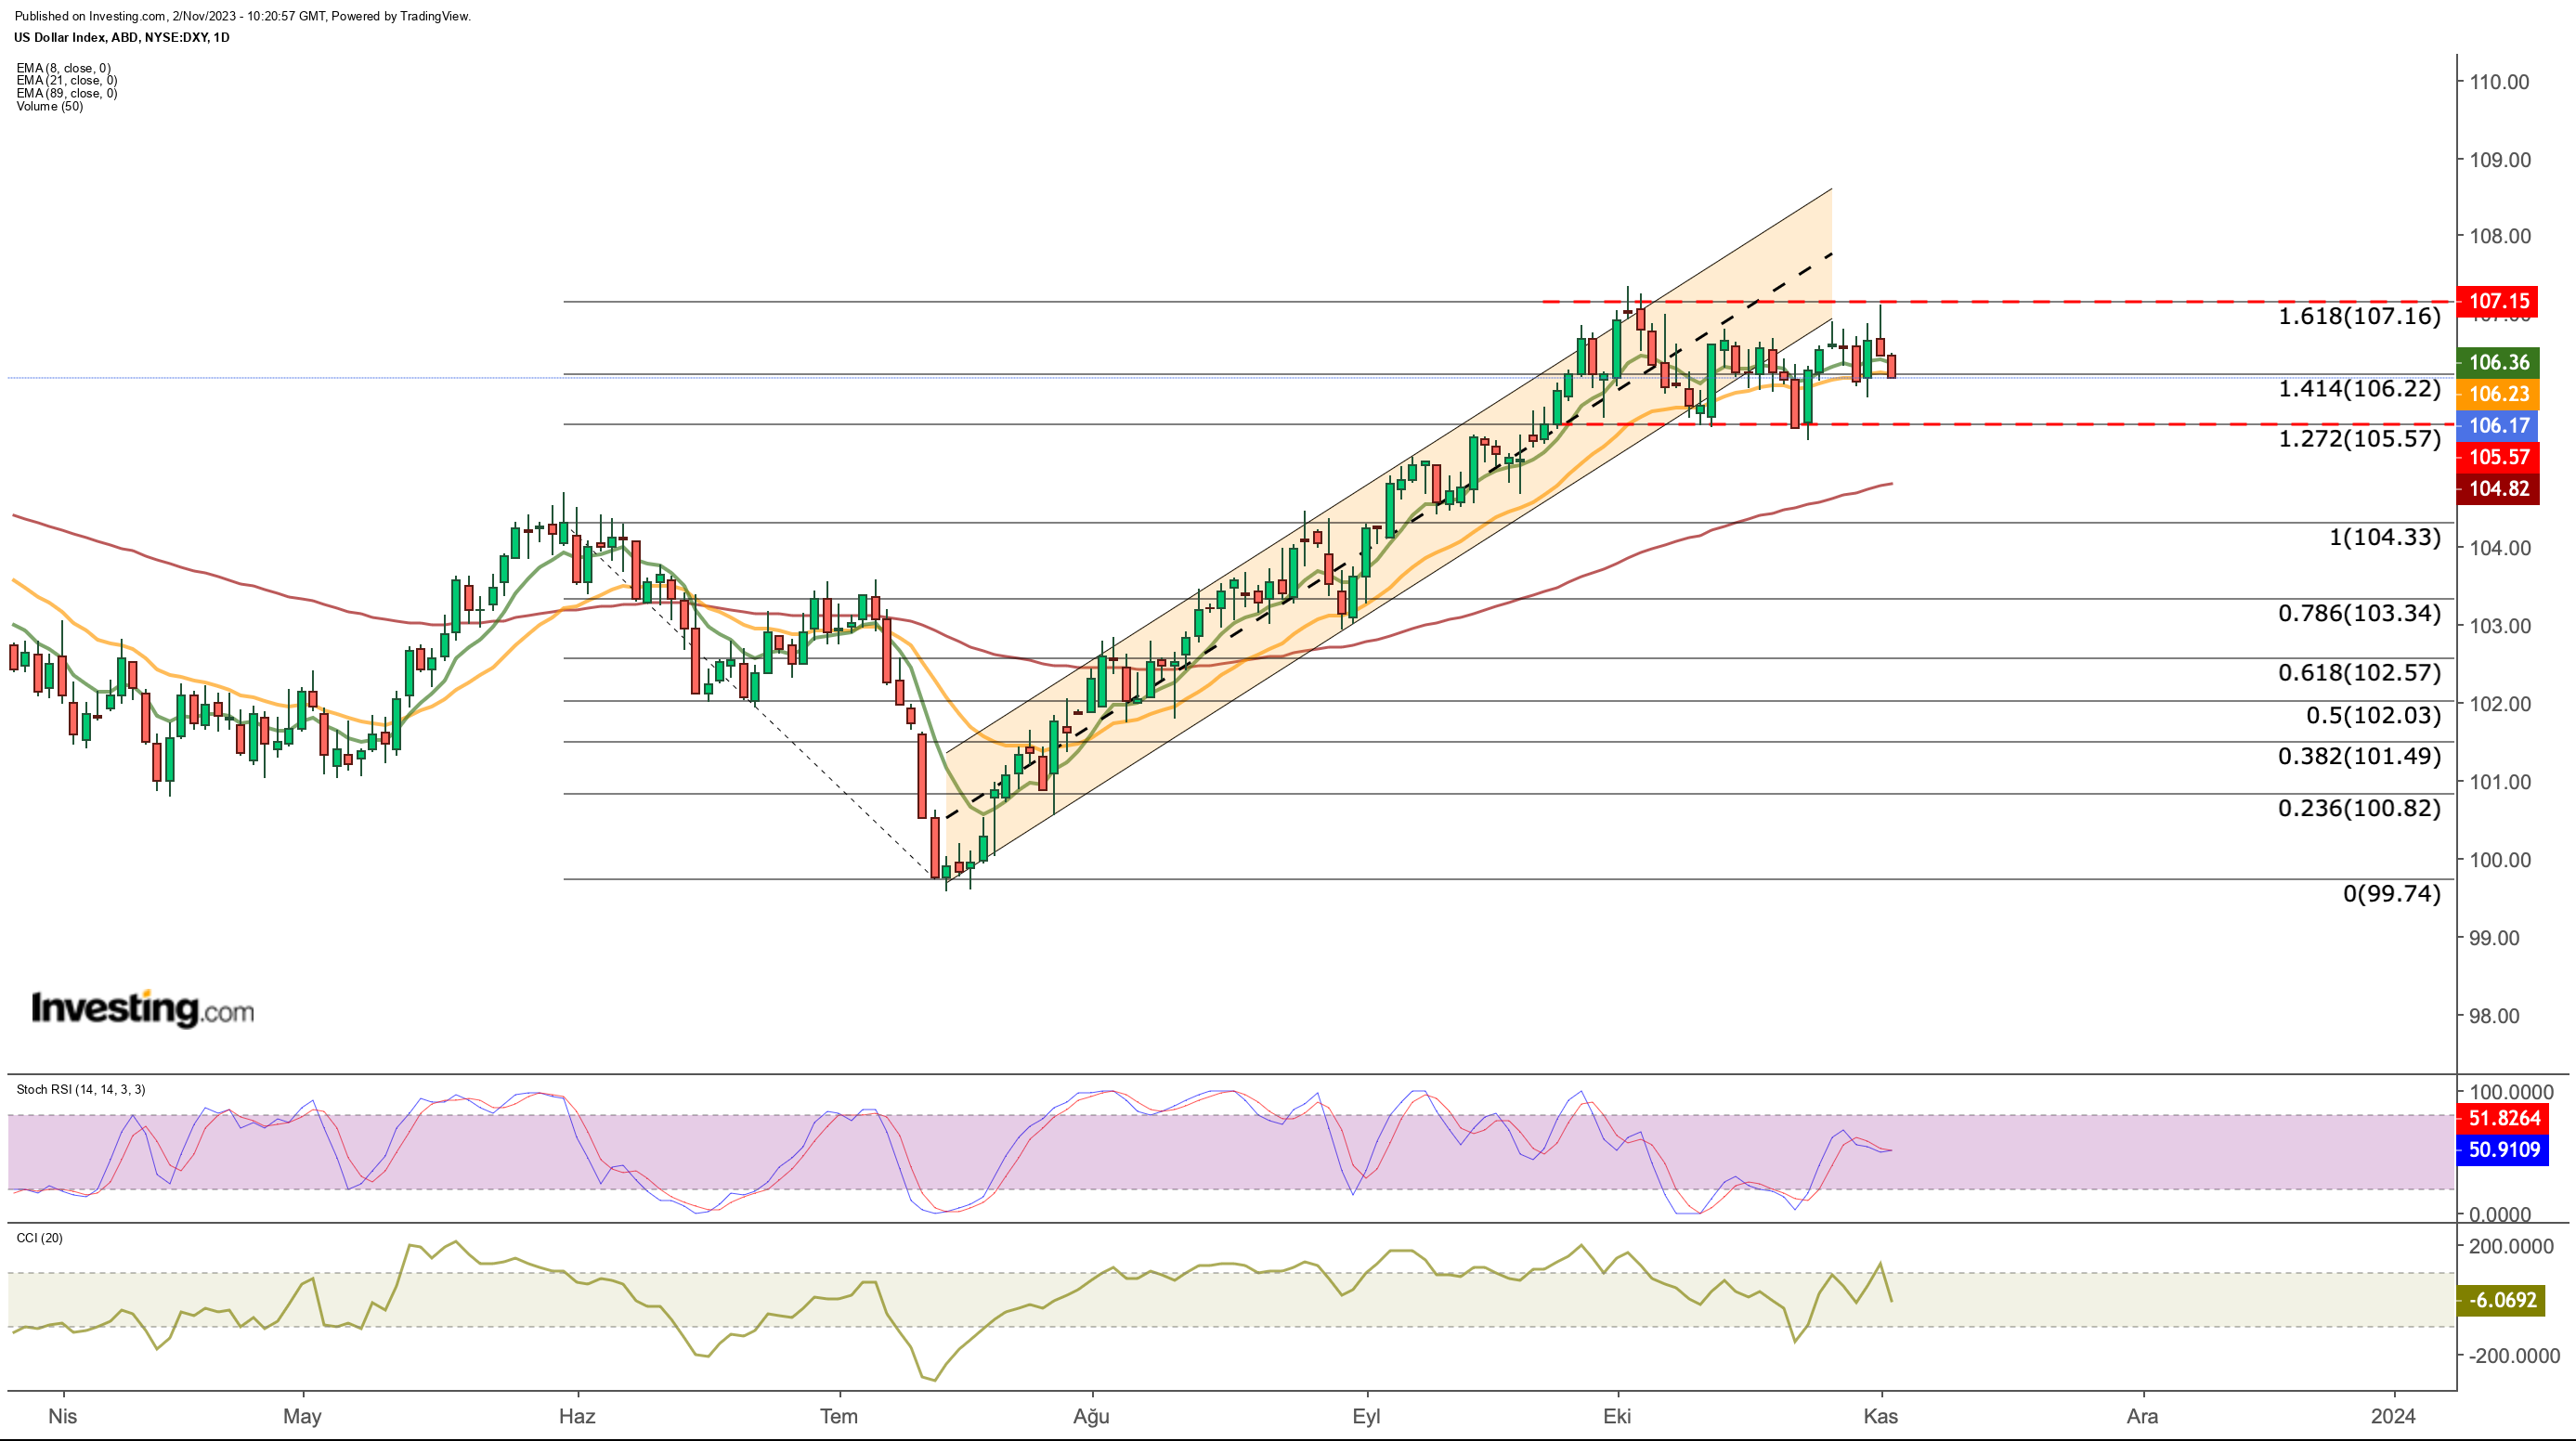
From a technical standpoint, a closer look at the dollar index reveals its persistent struggle around the 106.6 level. The DXY, having shifted from an uptrend to a horizontal pattern in October, now exhibits relative weakness, approaching the 107 range. The nearest support currently holds at 106.2 in the lower region.

In the DXY daily chart, we can observe that the 105.5 level also corresponds to the lower boundary of the channel that has formed over the past month. While the Fed’s less hawkish tone from yesterday contributed to the dollar’s weakening, it’s evident that the 106.2 support is currently under test. Should this level be breached, the second support at 105.5 may come into focus, and a potential breakout could lead to further depreciation in the dollar, potentially extending the index’s correction toward the 102-103 range.
On the other hand, considering the retracement from May to July, the peak achieved in October, and the failure to surpass the 107 level, it suggests that the cycle might have concluded within the Fibonacci expansion zone. From a technical perspective, the subsequent phase could involve a rapid correction below the 105 level.
Nonetheless, as long as the DXY remains above 105, it’s likely to maintain its status as a safe-haven asset. If mounting pressure from geopolitical risks prompts investors to seek refuge in the dollar, we might witness a short-term rally towards 108.5, supported by the 105 level.
In summary, the future trajectory of the dollar index seems contingent on clear daily closes beyond the 105 and 107 thresholds, shaping its next direction.
EUR/USD Technical View: Euro Attempts Recovery Vs. the Dollar
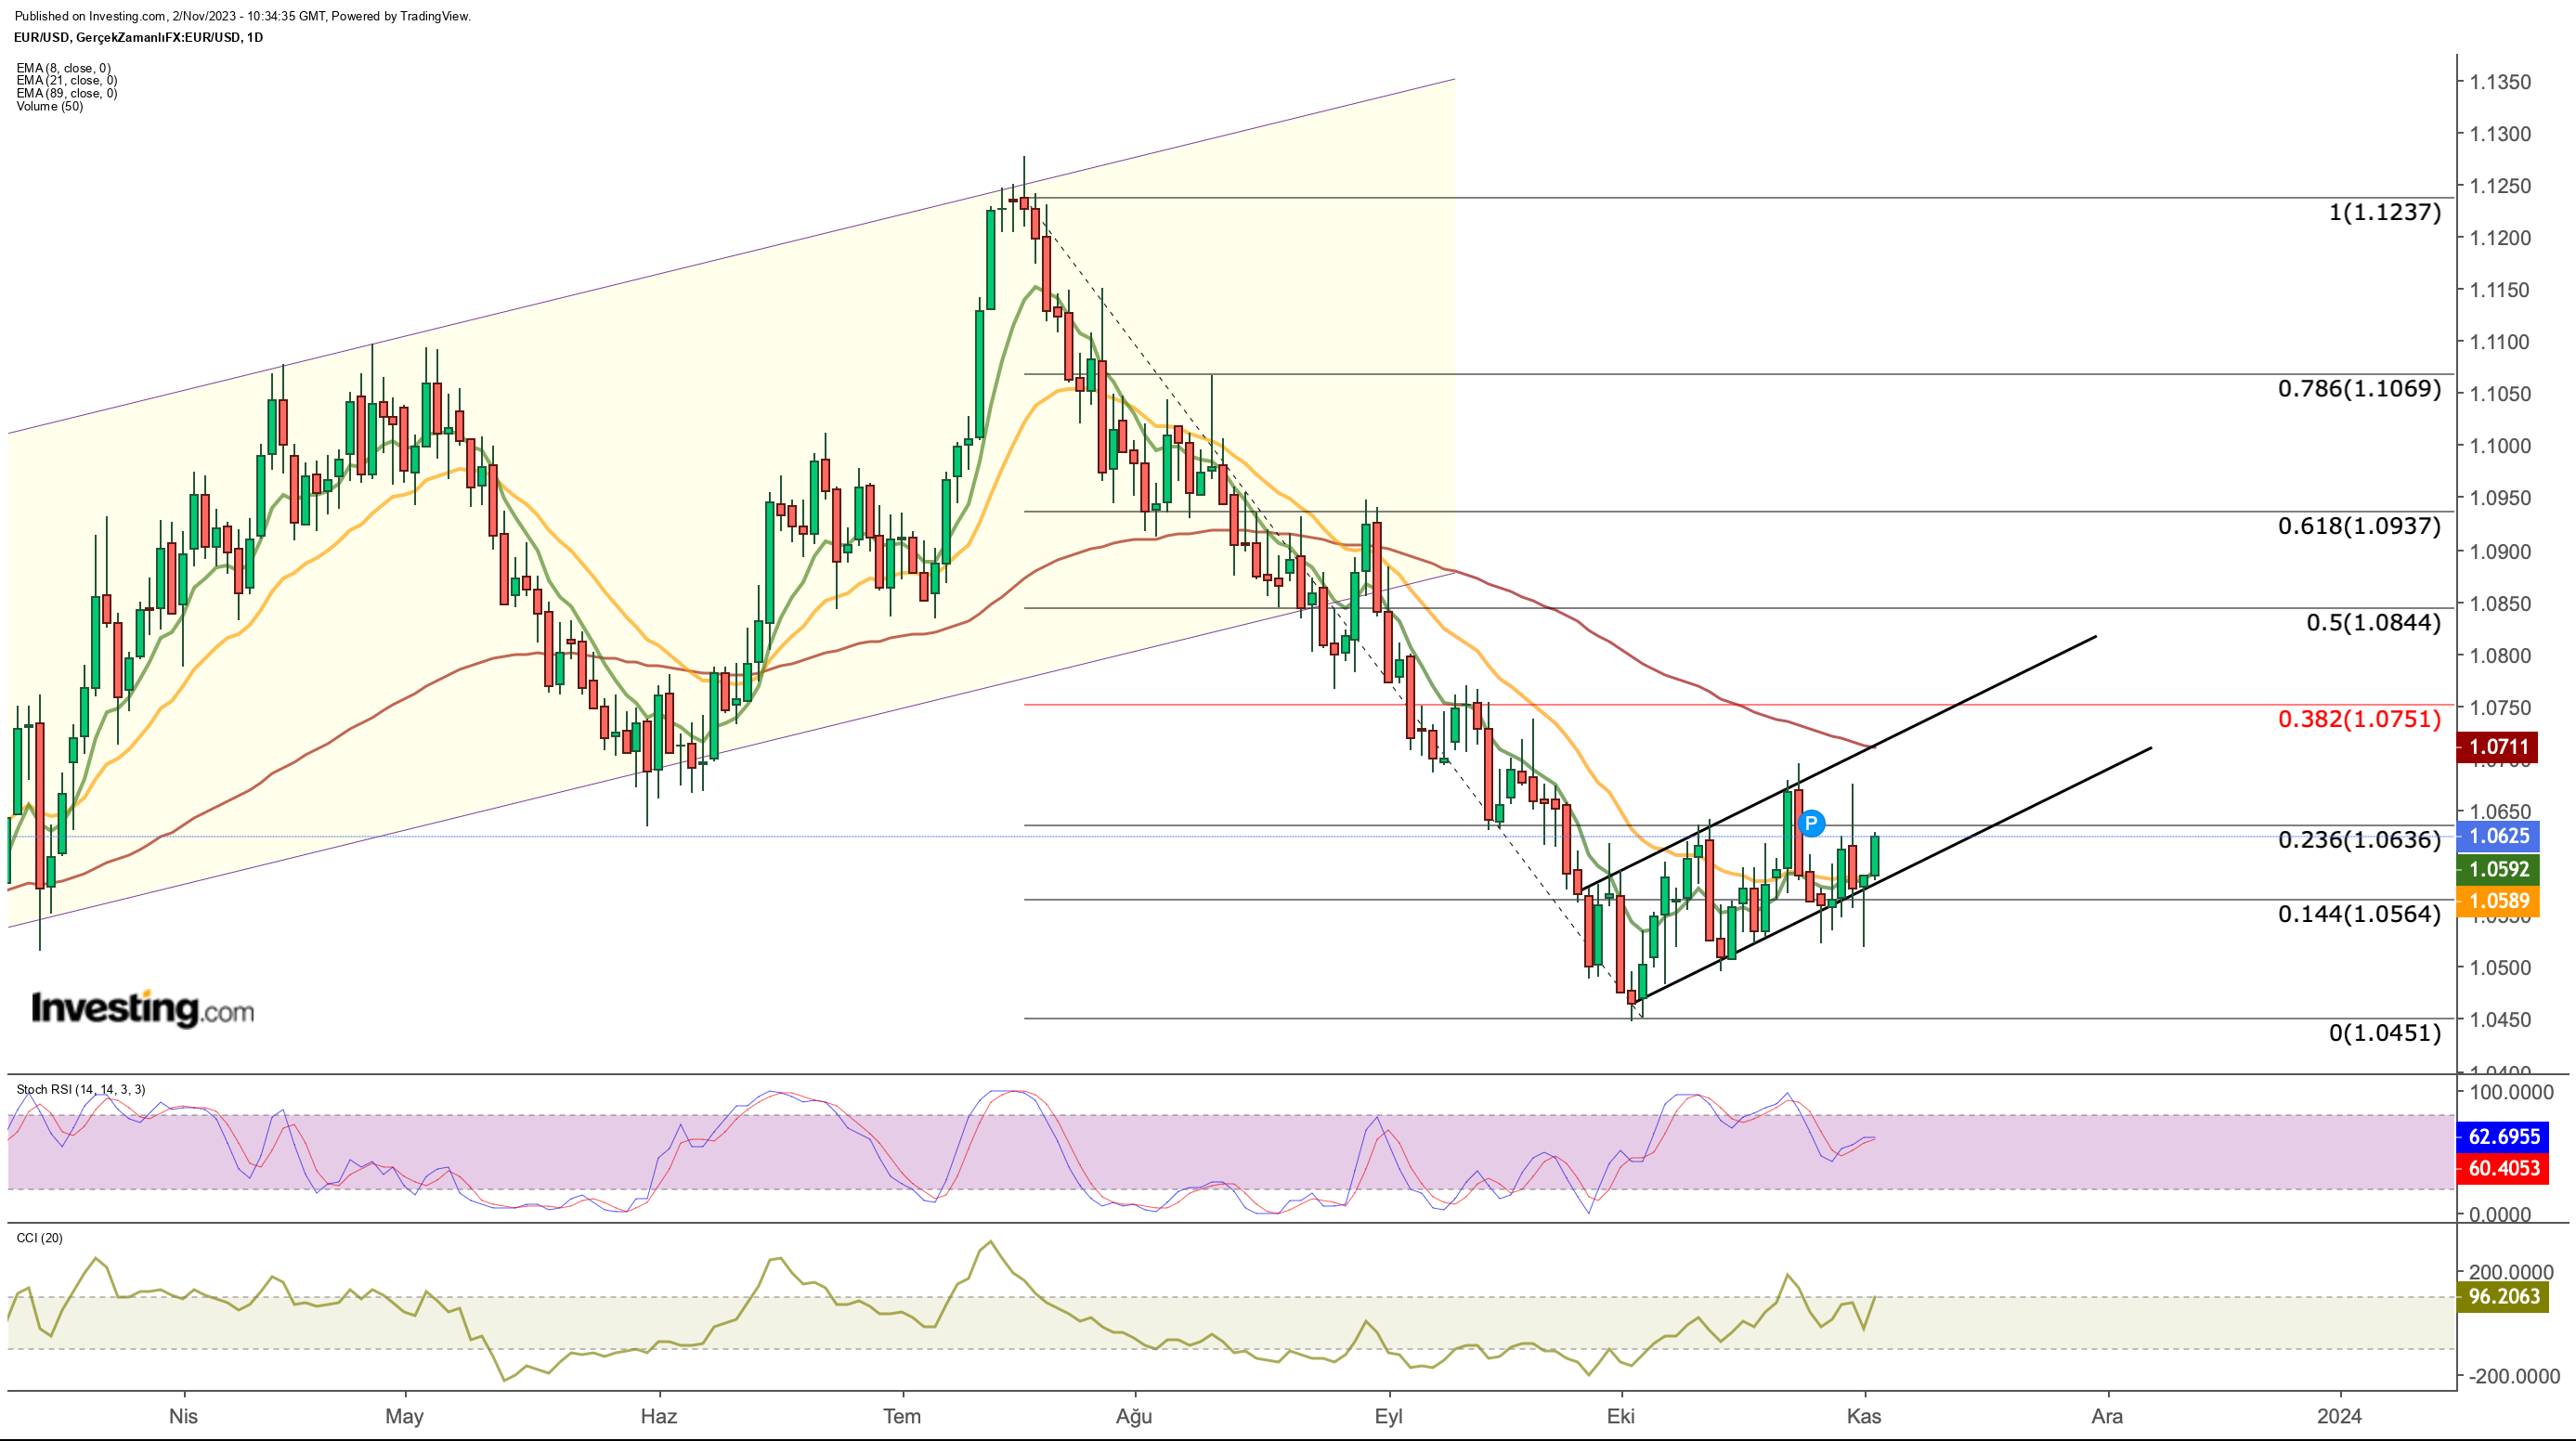
continues to attempt to recover from 1.04 levels in early October while moving horizontally. The euro started to show signs of halting its downward momentum last month after depreciating as much as 7% against the dollar from its July peak to October.

EUR/USD continues to test the resistance level at 1.0636. In the daily closing of the pair above this price level, we can see that the next move may be towards 1.075. This point could be decisive for a trend reversal in EUR/USD.
According to the latest situation, we can see that the pair can continue its way as long as it stays within the channel formed in the recovery attempt that started in October.
In case the bottom line of the channel is violated, the pair may retest the 1.045 region in daily closures below the 1.056 level, depending on the strengthening of the dollar.
***

Find All the Info You Need on InvestingPro!
Disclaimer: This article is written for informational purposes only; it does not constitute a solicitation, offer, advice, or recommendation to invest as such it is not intended to incentivize the purchase of assets in any way. I would like to remind you that any type of asset, is evaluated from multiple points of view and is highly risky and therefore, any investment decision and the associated risk remains with the investor.


