Unicorn Vs. Dinosaur Companies: Which Should You Pick?
2023.06.14 08:04
- Unicorn startups, typically in the service sector, prioritize rapid growth to achieve substantial success
- Dinosaur companies have large assets, facilities, and infrastructure and efficiently utilize substantial resources
- Let’s analyze these companies using InvestingPro. Looking for a helping hand in the market? Members of InvestingPro get exclusive access to our research tools and data. Learn More »
When it comes to classifying and labeling companies, there are various methodologies and classifications. A common one is to differentiate unicorns from dinosaurs.
Unicorn Companies
Back in 2013, Aileen Lee, the founder of Cowboy Ventures, coined the term “unicorn” to describe technology companies worth at least $1 billion. These companies possess the following defining characteristics:
-
Customer-Centric Approach: They prioritize the customer and place a strong emphasis on delivering exceptional user experiences.
-
Global Mindset: Unicorns have a vision for rapid expansion on a global scale, employing strategies to become big as quickly as possible.
-
Scalable and Innovative: They adopt scalable business models, allowing them to sustain growth without succumbing to their own success. They also foster innovation and maintain flexible organizational structures.
-
Service Sector Focus: Unicorns typically operate in the service sector, catering to various customer needs and demands.
-
Diverse and Disruptive Teams: Their teams consist of individuals from diverse backgrounds and cultures, fostering creativity and seeking disruptive ideas collaboratively.
-
Valuing Talent and Ambition: Unicorns highly value talent, creativity, and a passion for conquering new frontiers.
-
Social Media Savvy: Leveraging social networks effectively, they adeptly spread their message, philosophy, and products/services to a wider audience.
-
Embracing Resilience: Being on a roller coaster ride of emotions and experiences, these companies learn to navigate through ups and downs, developing strong resilience along the way.
Facebook (NASDAQ:) was once categorized as a unicorn company and then went on to be considered a super unicorn (those valued at least $100 billion).
Using InvestingPro, let’s delve into the journey of several unicorn companies and their evolution over time.
1. Airbnb
Airbnb (NASDAQ:) is a popular digital platform for property rentals. It will report on August 10, and they are expected to be favorable.

Airbnb Earnings
Source: InvestingPro
Two positive things from a technical point of view:
- It surpassed the 200-period moving average, which implies strength.
- It is trying to break above the downward trend line.
To confirm strength, it will have to break the resistance at $127.07.

2. Uber Technologies
Uber Technologies (NYSE:) connects users with private drivers through its app for convenient transportation. It is expected to report positive on August 10.

Uber Earnings
Source: InvestingPro
From a technical perspective, there are some interesting observations:
- It successfully surpassed the resistance level formed in February.
- This breakthrough involved a throwback, where the price temporarily drops back to touch the zone before continuing its upward movement. This suggests that a potential entry point could be around $37.25.
- In the near future, it will attempt to break out of the ascending channel and encounter resistance at $44.42.

Dinosaur Companies
Dinosaur companies are usually characterized by their large assets, facilities, infrastructure, and mobilization of high volumes of production factors.
Let’s take a look at some examples.
1. IBM
International Business Machines (NYSE:) manufactures and markets computer hardware and software, along with offering infrastructure, internet hosting, and consulting services.
Founded in 1911 through a merger, IBM will report its on July 19, expected to be consistent with previous outcomes.

IBM Earnings
Source: InvestingPro
In the chart, we can see two interesting things:
-
Following a significant decline from December 2022 to May 2023, there was a subsequent upward trend, marked by breaking the bearish guideline on May 18, indicating a sign of strength.
-
The stock has recently reached the initial two Fibonacci targets after moving up. The next target is at $140.70, but it needs to surpass the resistance level at $137.35 first.

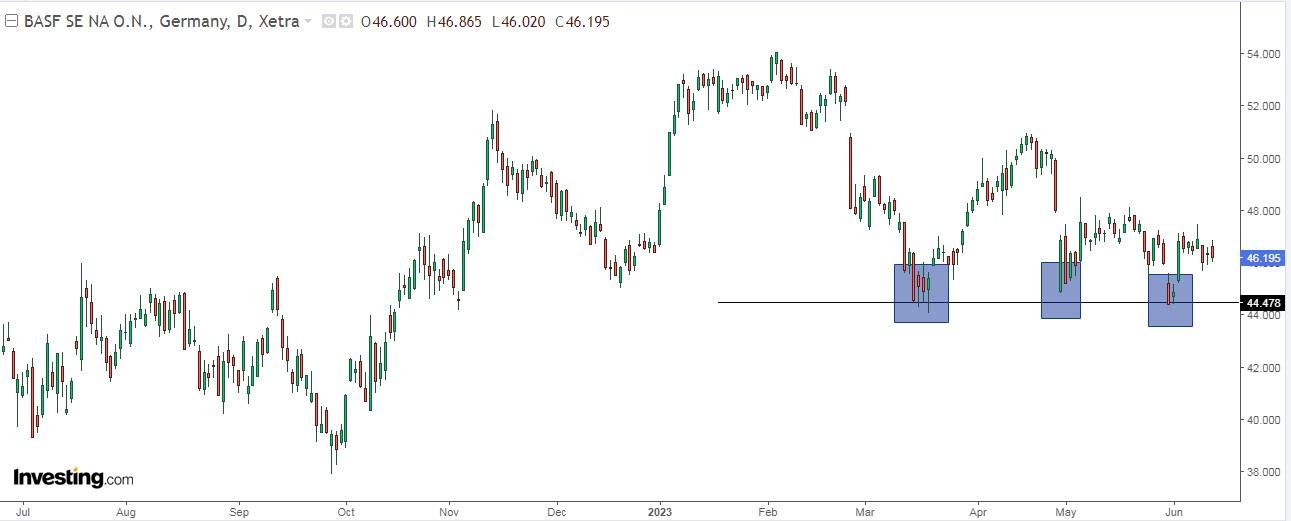
2. BASF
BASF SE (OTC:) (ETR:), founded in 1865 in Ludwigshafen, Rhineland-Palatinate, is a leading chemical company initially focused on dye production.
It currently holds the title of the world’s largest chemical company, surpassing competitors such as Dow Inc. (NYSE:) and DuPont de Nemours, Inc. (NYSE:).
The company is scheduled to release its on July 28, and positive expectations surround the upcoming report.

BASF Earnings
Source: InvestingPro
It is at an interesting moment, close to the support that has always worked very well when it was touched, bouncing the price upwards. This support is at €44.41.

The InvestingPro tools assist savvy investors in analyzing stocks. By combining Wall Street analyst insights with comprehensive valuation models, investors can make informed decisions while maximizing their returns.
You can conveniently access a single-page view of complete and comprehensive information about different companies all in one place, saving you time and effort.
Start your InvestingPro free 7-day trial now!

Find All the Info you Need on InvestingPro!
Disclaimer: This article is written for informational purposes only; it does not constitute a solicitation, offer, advice, counseling, or recommendation to invest as such it is not intended to incentivize the purchase of assets in any way. As a reminder, any type of asset is evaluated from multiple points of view and is highly risky and therefore, any investment decision and the associated risk remain with the investor. The author does not own the stocks mentioned in the analysis.


