U.S. summer stock rally at risk as September looms
2022.08.26 07:53

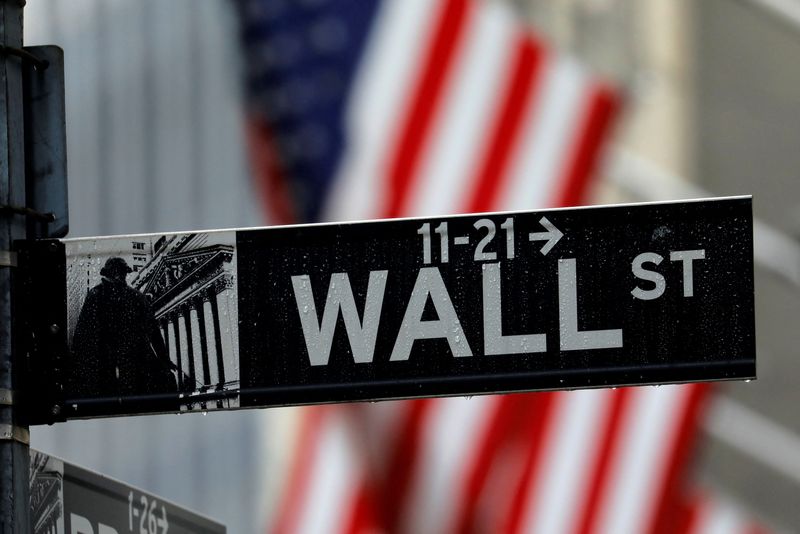
FILE PHOTO: Raindrops hang on a sign for Wall Street outside the New York Stock Exchange in Manhattan in New York City, New York, U.S., October 26, 2020. REUTERS/Mike Segar
By David Randall
NEW YORK (Reuters) – The 13% rally in the S&P 500 from its June lows will soon run into what has historically been the toughest month for the U.S. stock market, sparking nerves among some fund managers of a broad selloff in September.
The S&P has been in a bear market since plummeting early this year as investors priced in the expectation of aggressive Federal Reserve interest rate hikes, but has rallied strongly since June, regaining half its losses for the year.
That rebound has been fueled by a combination of strong earnings from bellwether companies and signs that inflation may have peaked, potentially allowing the Fed to slow rate hikes.
But as investors and traders return from summer holidays, some are nervous about a bumpier ride in September, partly due to seasonal concerns and partly due to nervousness about the Fed’s pace of hikes and the resulting impact on the economy.
September typically is a down month for the stock market because fund managers tend to sell underperforming positions as the end of the third quarter approaches, according to the Stock Trader’s Almanac.
“We’ve had a breathtaking run and I wouldn’t be shocked if the market takes a hit here,” said Jack Janasiewicz, lead portfolio strategist at Natixis Investment Management Solutions.
The S&P 500 could fall by as much as 10% in September as investors price in the likelihood that the Fed will not start to cut rates as early as some hoped, Janasiewicz said.
September has traditionally been the worst month for the S&P 500 in the years since 1945, with the index advancing only 44% of the time, the lowest of any month, according to CFRA data. The S&P 500 has posted an average loss of 0.6% in September, the worst showing of any month.
The index is down 13.1% for the year to date. That performance has been helped by a nearly 14% gain since June, when the index hit its lowest level since Dec. 2020 and entered a bear market after the Fed announced its largest rate hike since 1994.
Chief among the reasons for the gloomy outlook is a belief that the Fed will continue hiking interest rates and will keep them above the neutral rate longer than markets had anticipated as recently as a week ago, weighing on consumer demand and the housing market.
Nearly half of market participants now expect the fed funds rate to move above 3.7% by the end of the year, up from 40% a week ago, according to the CME FedWatch tool [/FEDWATCH]. The fed funds rate is currently between 2.25 and 2.5%.
When Fed Chair Jerome Powell speaks on Friday, market participants will be eager for any hints about how long the central bank anticipates hiking rates. Powell, who is making a keynote speech at the Kansas City Federal Reserve’s annual monetary policy conference in Jackson Hole, Wyoming, may use the opportunity to cool expectations among investors of cuts to borrowing costs in 2023.
The FOMC meeting scheduled for Sept. 20 and 21 will also likely drive volatility during the month, prompting the S&P 500 to fall near its June lows, said Sam Stovall, chief investment strategist at CFRA. Ahead of that will be critical economic data, such as a reading on consumer prices that will give investors more insight into whether inflation has peaked.
The strong rally since June, however, suggests that the index will continue to rebound through December, Stovall said.
“While we might end up retesting the June low, history says that we will not set a new low,” he said.
While fund managers as a whole remain bearish, the ratio of bulls to bears has improved since July, reducing the likelihood of outsized gains in the months ahead, according to Bank of America (NYSE:BAC) survey released Aug. 16. The bank’s clients were net sellers of US equities last week for the first time in 8 weeks, suggesting that investors are growing more defensive, the bank said.
At the same time, the use of leverage by hedge funds – a proxy for their willingness to take risk – has stabilized since June and is now near the lowest level since March 2020, according to Goldman Sachs (NYSE:GS).
Investors may continue to rotate out of cyclical, value-oriented stocks that benefit from rising inflation and into technology and other growth stocks that can take market share despite an economic slowdown as the Fed continues to emphasize that it will maintain rates until they see signs of the labor market cooling, said Tiffany Wade, senior portfolio manager at Columbia Threadneedle Investments, who is overweight mega-cap stocks like Amazon.com (NASDAQ:AMZN) and Micrsoft Corp.
“We expect the pullback will start with some of the riskier names that have run up a lot since June,” she said.


