Top 3 Tech Gems Set to Ride Disinflationary Trend to Double-Digit Gains
2023.12.05 09:02
- Recent disinflation trends have made rate cuts more likely next year
- And, tech companies may be beneficiaries of the new bull market
- So, we will take a look at three tech stocks that are likely to benefit from the disinflation trend and the bull market
- Missed out on Black Friday? Secure your up to 60% discount on InvestingPro subscriptions with our extended Cyber Monday sale.
Progressive disinflation has become a reality across key global economies, signaling that the Fed and other central banks may start considering pivoting their monetary policies as early as H1 next year.
In fact, despite the central bank’s cautious remarks on a potential pivot, the market is currently pricing in a rate cut cycle starting in May, leading to strong gains for stocks globally.
The alone recorded a significant uptick of around 5% in November, continuing its ascent toward historic highs.
In such an environment, technology companies stand poised for solid growth during this bullish phase. Let’s explore three tech companies with the potential for double-digit returns in the coming months.
1. inTEST Corporation
First on our radar is inTest Corporation (NYSE:), a New Jersey-based company specializing in semiconductor manufacturing for diverse sectors, including automotive, defense, industrial, and security.
The semiconductor industry, fueled by advancements like artificial intelligence and increased government investments, holds promising growth prospects.
According to estimates from the Semiconductor Industry Association, the market is projected to reach $1.03 trillion, boasting an average annual growth rate of 9.2%.
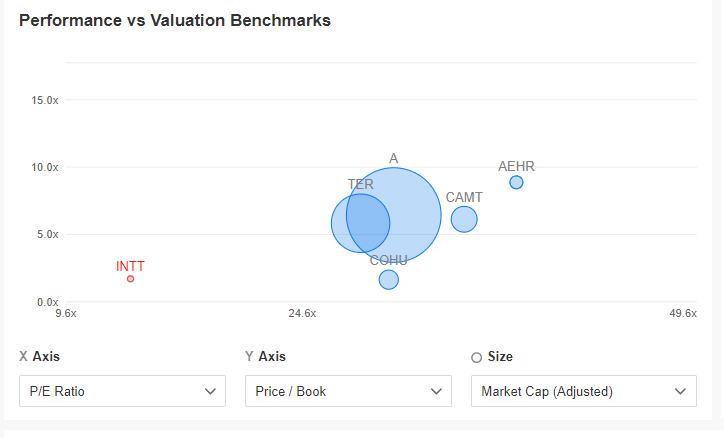
Delving into fundamentals, inTEST Corporation presents an enticing price/earnings and price/book value proposition compared to its competitors.
Additionally, the company showcases stability in earnings and revenues, coupled with a high fair value of 34.5%.
 Performance Vs. Valuation
Source: InvestingPro
The negatives certainly include the fact that the company does not pay dividends, so it may not be an ideal position for long-term defensive portfolios.
2. STMicroelectronics NV
STMicroelectronics NV (NYSE:) operates in the semiconductor industry, benefiting from the positive trends outlined earlier. A closer examination reveals several noteworthy insights:
- High Return on Invested Capital (ROIC): STMicroelectronics NV boasts a nice return on invested capital, standing at an impressive 28.1%. This signifies the company’s efficiency in generating returns from its invested capital.
- Healthy Net Debt/Total Capital Ratio: The net debt/total capital ratio indicates that the company has a comfortable margin to cover its liabilities, even with available free cash. This financial strength contributes to the company’s stability.
- Consistent Dividend Payments: STMicroelectronics NV has a track record of consistently paying dividends. This not only attracts income-focused investors but also reflects the company’s confidence in its financial position.
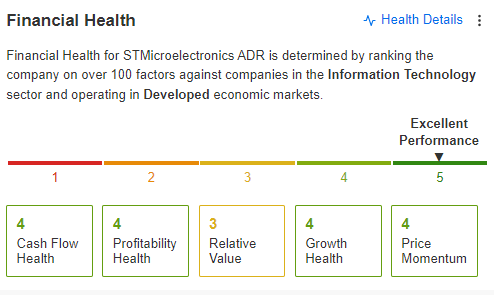
- Optimal Financial Health: The maximum financial health score underscores the company’s excellent fundamental condition. This overall assessment reinforces the positive outlook for STMicroelectronics NV in terms of financial health and stability.

src=
Source: InvestingPro
Despite the notable increases throughout November, the P/E ratio remains at a relatively low 8.9x, suggesting a potentially attractive market valuation.
3. Teradata Corporation
Teradata Corp (NYSE:) provides software, products, and services related to cloud databases and analytics.
After a period of rapid stock price appreciation between October 2022 and August 2023, the share price suffered a sharp decline after the release of Q2 2023 , even though the underlying earnings per share and revenue figures were above expectations.
It seems that investors’ reaction, which was mainly related to the decline in gross margin, may have been exaggerated, as the stock price is recovering from the publication of Q3 figures, which again beat market consensus.
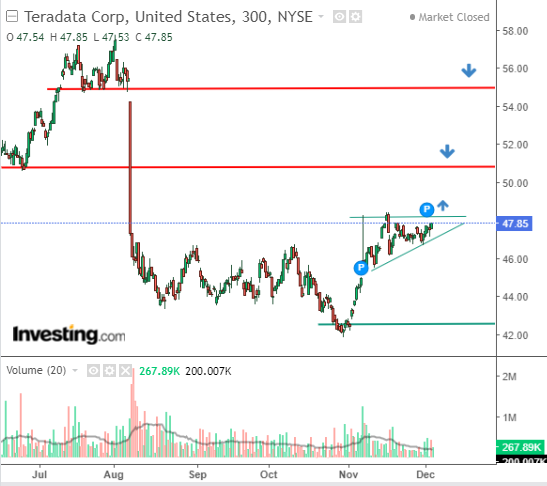
The company currently enjoys a positive fair value ratio of 34.5%, but the key in the short term will be the realization of the technical triangle formation, which, at least in theory, is a harbinger of further increases.

Teredata Corp Price Chart
If this play succeeds for buyers, then the next target should be the area around $51 per share.
***
You can easily determine whether a company is suitable for your risk profile by conducting a detailed fundamental analysis on InvestingPro according to your criteria. This way, you will get highly professional help in shaping your portfolio.
In addition, you can sign up for InvestingPro, one of the most comprehensive platforms in the market for portfolio management and fundamental analysis, much cheaper with the biggest discount of the year (up to 60%), by taking advantage of our extended Cyber Monday deal.

Claim Your Discount Today!
Disclaimer: This article is written for informational purposes only; it does not constitute a solicitation, offer, advice, or recommendation to invest as such it is not intended to incentivize the purchase of assets in any way. I would like to remind you that any type of asset, is evaluated from multiple points of view and is highly risky and therefore, any investment decision and the associated risk remains with the investor.


