Texas grid avoids summer blackouts with $1 billion in extra spending
2022.08.25 16:13
2/2

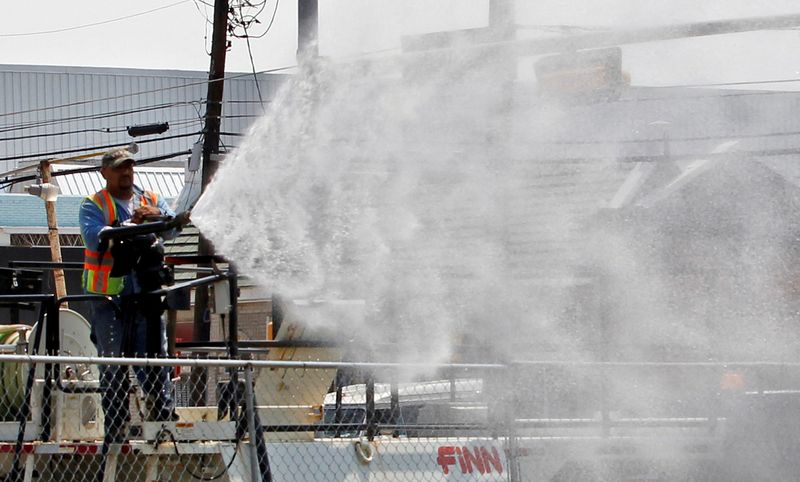
FILE PHOTO: Enrique Rivera sprays water on newly planted grass along the side of a Dallas street during a prolonged heat wave in Dallas, Texas July 18, 2011. REUTERS/Mike Stone/File Photo
2/2
By Swati Verma
(Reuters) – Texas’ electric grid operator has powered through record demand this summer by paying more to keep higher reserves and rewarding industrial consumers to cut usage, a combination that has added more than $1 billion to power fees.
The Electric Reliability Council of Texas (ERCOT) has set new demand records 11 times this summer and twice asked consumers to turn up their thermostats in a season where demand approached 80,000 megawatts (MW). It had forecast peak summer demand earlier this year of 77,733 MW in January.
Graphic: ERCOT broke demand records 11 times in 2022 summer https://graphics.reuters.com/TEXAS-POWER/ERCOT/lbvgnaxkrpq/chart.png
Staving off a blackout became a priority after a February 2021 cold spell killed over 200 people, left millions of Texas homes and businesses without heat and power, and sent wholesale prices soaring.
The measures also reflect political danger of another outage. Governor Greg Abbott, who appoints utility commissioners, this fall is facing his toughest reelection challenge in years.
The grid operator, which oversees provision of power to more than 26 million customers, has revamped its approach of raising the prices paid for power as demand nears the limit of available reserves. This year, it added 50% to what it keeps as a safety margin, increasing costs.
The state’s Independent Market Monitor (IMM), which provides a check on the ERCOT’s operations, recently estimated the higher level of safety reserves has cost $1 billion during the first seven months of 2022.
“ERCOT has brought generators online to achieve reserves that the current market does not support or to provide power at higher demand times when expected renewable energy has been unavailable,” said Michele Richmond, executive director of the Texas Competitive Power Advocates, an association representing power companies.
“When those generators are needed for reliability and are called online through conservative operations, the higher fuel costs are ultimately paid by consumers with no ability on the part of either retail electric providers or large and sophisticated consumers to hedge the costs.”
A side effect of the higher safety margin is the costs of running generators when not fully needed are reflected in service costs passed along to all providers. These ancillary service costs amounted to $350 million in the first five months this year.
ERCOT defends the higher safety margin as needed to meet forecast demand and says the ancillary services fees are paid for by companies utilizing its management services, not consumers.
“ERCOT does not determine how and when adjustments are made to rate payers,” ERCOT spokeswoman Trudi Webster said.
Grid costs this year have also risen the mismatch between where power in the state is plentiful and to where it is most needed and supplies dear. Providers in Houston earlier this year were paying $4,000 per megawatt hour compared to negative prices 150 miles (241 km) away.
These congestion costs amounted to $2.1 billion through July, compared with $2.1 billion for all of last year, the state’s IMM estimated.
Graphic: ERCOT’s real-time congestion costs already hit $2.1 billion at the end of July https://graphics.reuters.com/TEXAS-POWER/ERCOT/zdpxozbkqvx/chart.png
The growth in the state’s renewable generation in areas lacking sufficient transmission capacity and higher gas prices paid by thermal power plans account for much of the increase in congestion costs, said Morris Greenberg, senior manager, North America power analytics, S&P Global (NYSE:SPGI) Commodity Insights.
ERCOT primarily relies on higher-cost natural gas for its power generation and soaring prices of the fuel, up more than 150% so far this year, have added to price pressures.


