Tesla Stock Looks Poised for Turnaround Despite Headwinds
2023.08.22 08:57
- Tesla stock price rebounded on Monday, reversing recent downtrend
- The EV maker faces challenges from increased competition and China’s economic slowdown
- Technical analysis suggests the stock could resume uptrend
After more than a month on the low, Tesla (NASDAQ:) appears to be finally staging a comeback. Yesterday, the Electric Vehicle (EV) giant’s stock surged by an impressive 7%, the first noteworthy rebound rise following the dip prompted by the company’s worse-than-expected on July 19th.
The stock has dropped almost 30% from its peak of around $300 in 2023 due to economic problems and pricing worries in China, a major electric vehicle market. Elon Musk, on the other hand, indicated he won’t hesitate to lower prices to stay competitive.
Recent data from China showed Tesla’s sales fell 31% last month compared to June, hitting the lowest point in 2023. However, Tesla’s competitors in China reported increased vehicle deliveries.
Tesla’s July decline, while rivals upped deliveries, was tied to a sales campaign in the previous year’s final months. Bank of America analysts argued this price cut pulled demand forward instead of increasing sales volume.
Baird’s upbeat outlook at the start of the week gave TSLA a boost. Analysts believe price cuts could positively impact the company’s profit margins for the rest of the year.
Moreover, the Cybertruck launch and expectations of increased demand due to FSD (fully autonomous driving software) also contribute to Tesla’s positive outlook. The company’s energy business growth is seen as another driving factor.
Tesla’s energy storage sector gained significant traction in 2023, reaching 7.5 gigawatts of battery storage per hour in the first half of the year, a nearly 280% increase. This boosted the company’s non-core profit margin and overall sales.
However, despite these positive projections, Tesla will likely face challenges due to increased competition in the electric vehicle market and China’s unfavorable economic situation.
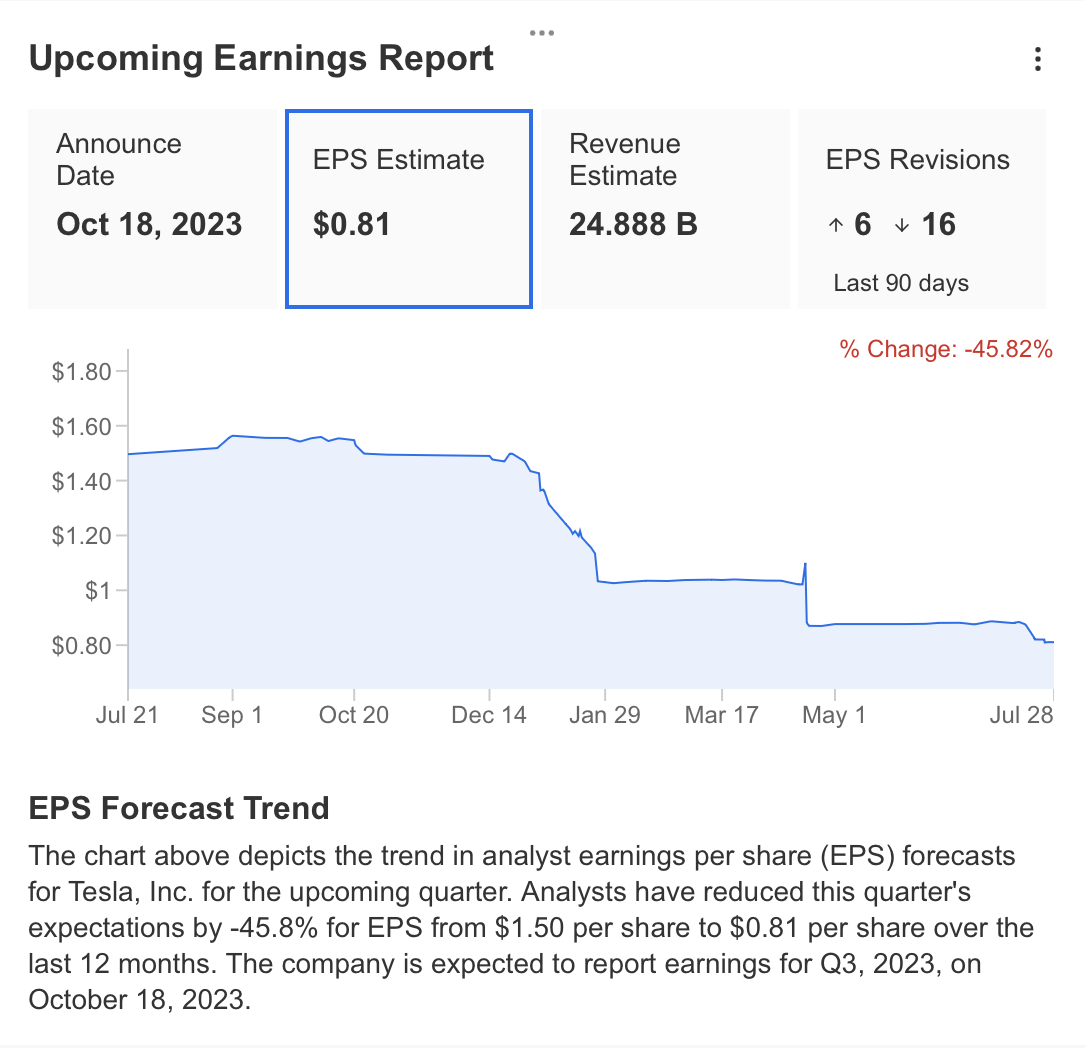
Data from the InvestingPro platform shows that 16 analysts have revised their opinions negatively. Currently, analysts estimate Tesla’s earnings per share for the upcoming October report at $0.89, down 45%.
Predicting lower quarterly earnings, analysts anticipate Q3 revenue of around $24.888 billion.
 Source: InvestingPro
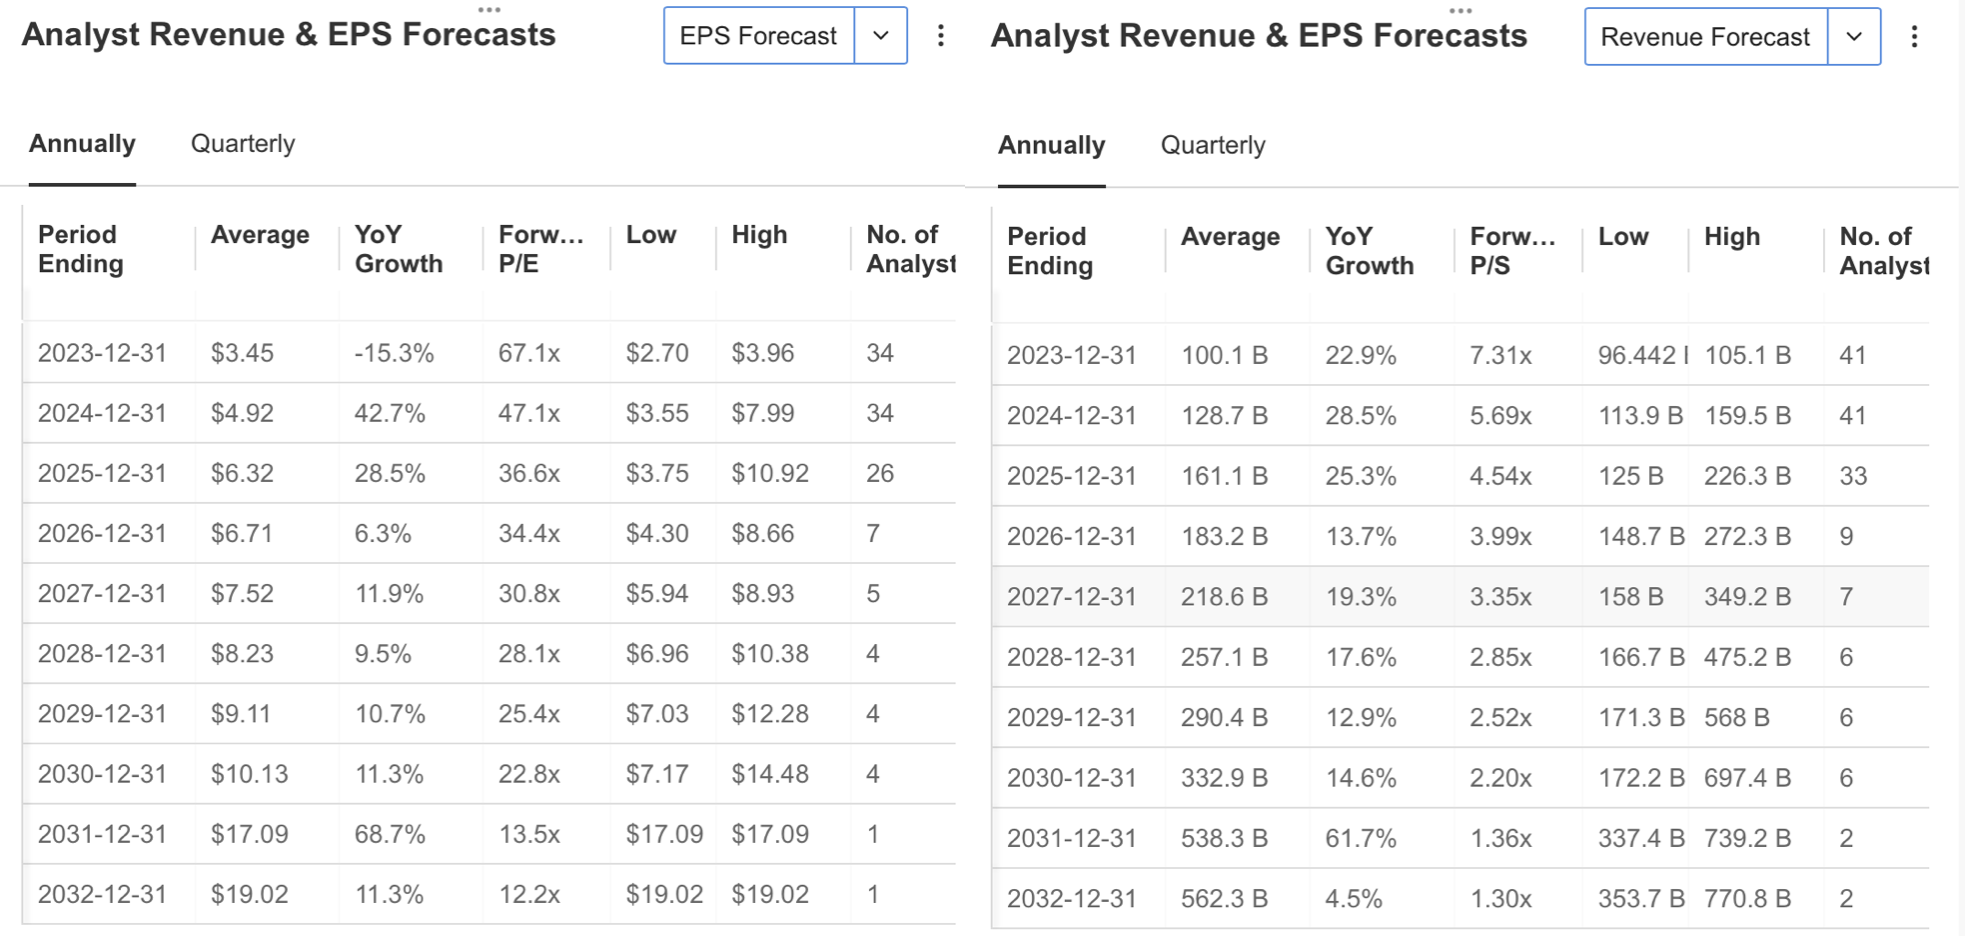
As a result, analysts, who predict a 15% drop in profit per share for 2023, maintain a positive outlook on long-term predictions.
 Source: InvestingPro
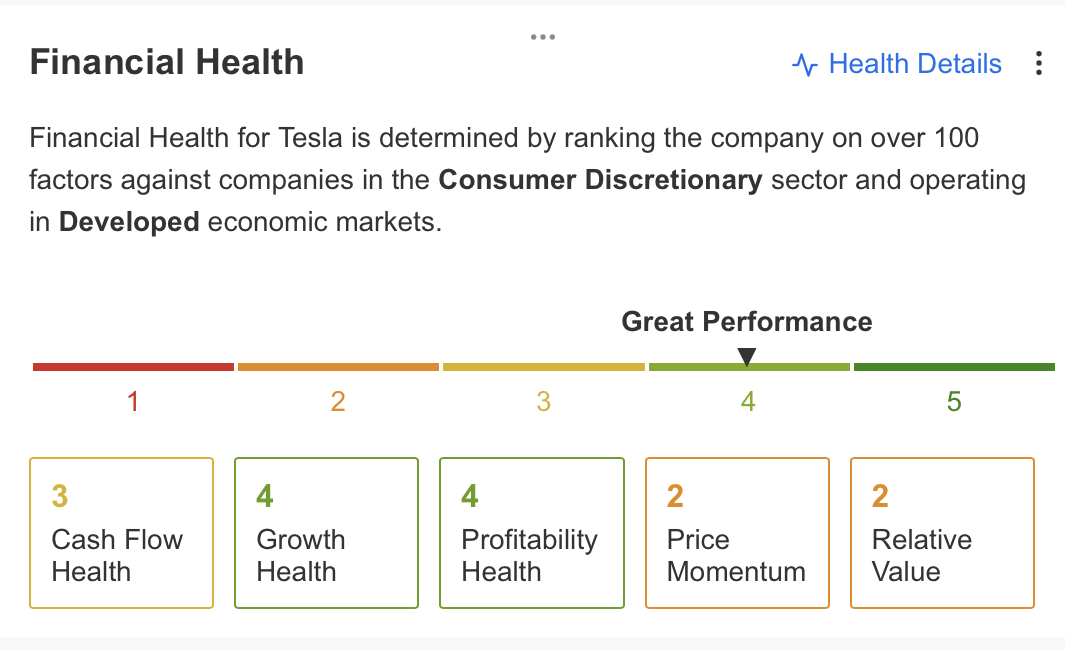
Checking out the overall health of the company on the InvestingPro platform, we can spot impressive performance. Tesla’s most recent financial results paint a strong picture, especially in terms of profitability and growth margins.
However, when it comes to cash flow, there’s room for improvement, particularly in the stock’s price momentum and relative value.
In a nutshell, Tesla’s current outlook has its ups and downs. On the bright side, the balance sheet shows more cash than debt, profit per share keeps growing steadily, and there’s an expectation of sales picking up throughout the year.
On the flip side, the high price-to-earnings ratio, the stock’s rollercoaster-like price movements, and the absence of dividend distribution are some negatives investors should consider.
 Source: InvestingPro
Looking into Tesla’s fair value estimate for its shares, the fair value determined through 12 financial models on InvestingPro is presently sitting at $247.
This assessment aligns with the average estimate derived from 36 analysts and indicates that the current price of $231 is discounted by 3%. However, from a technical perspective, the fair value level calculated for Tesla highlights a significant resistance zone.
Tesla: Technical View
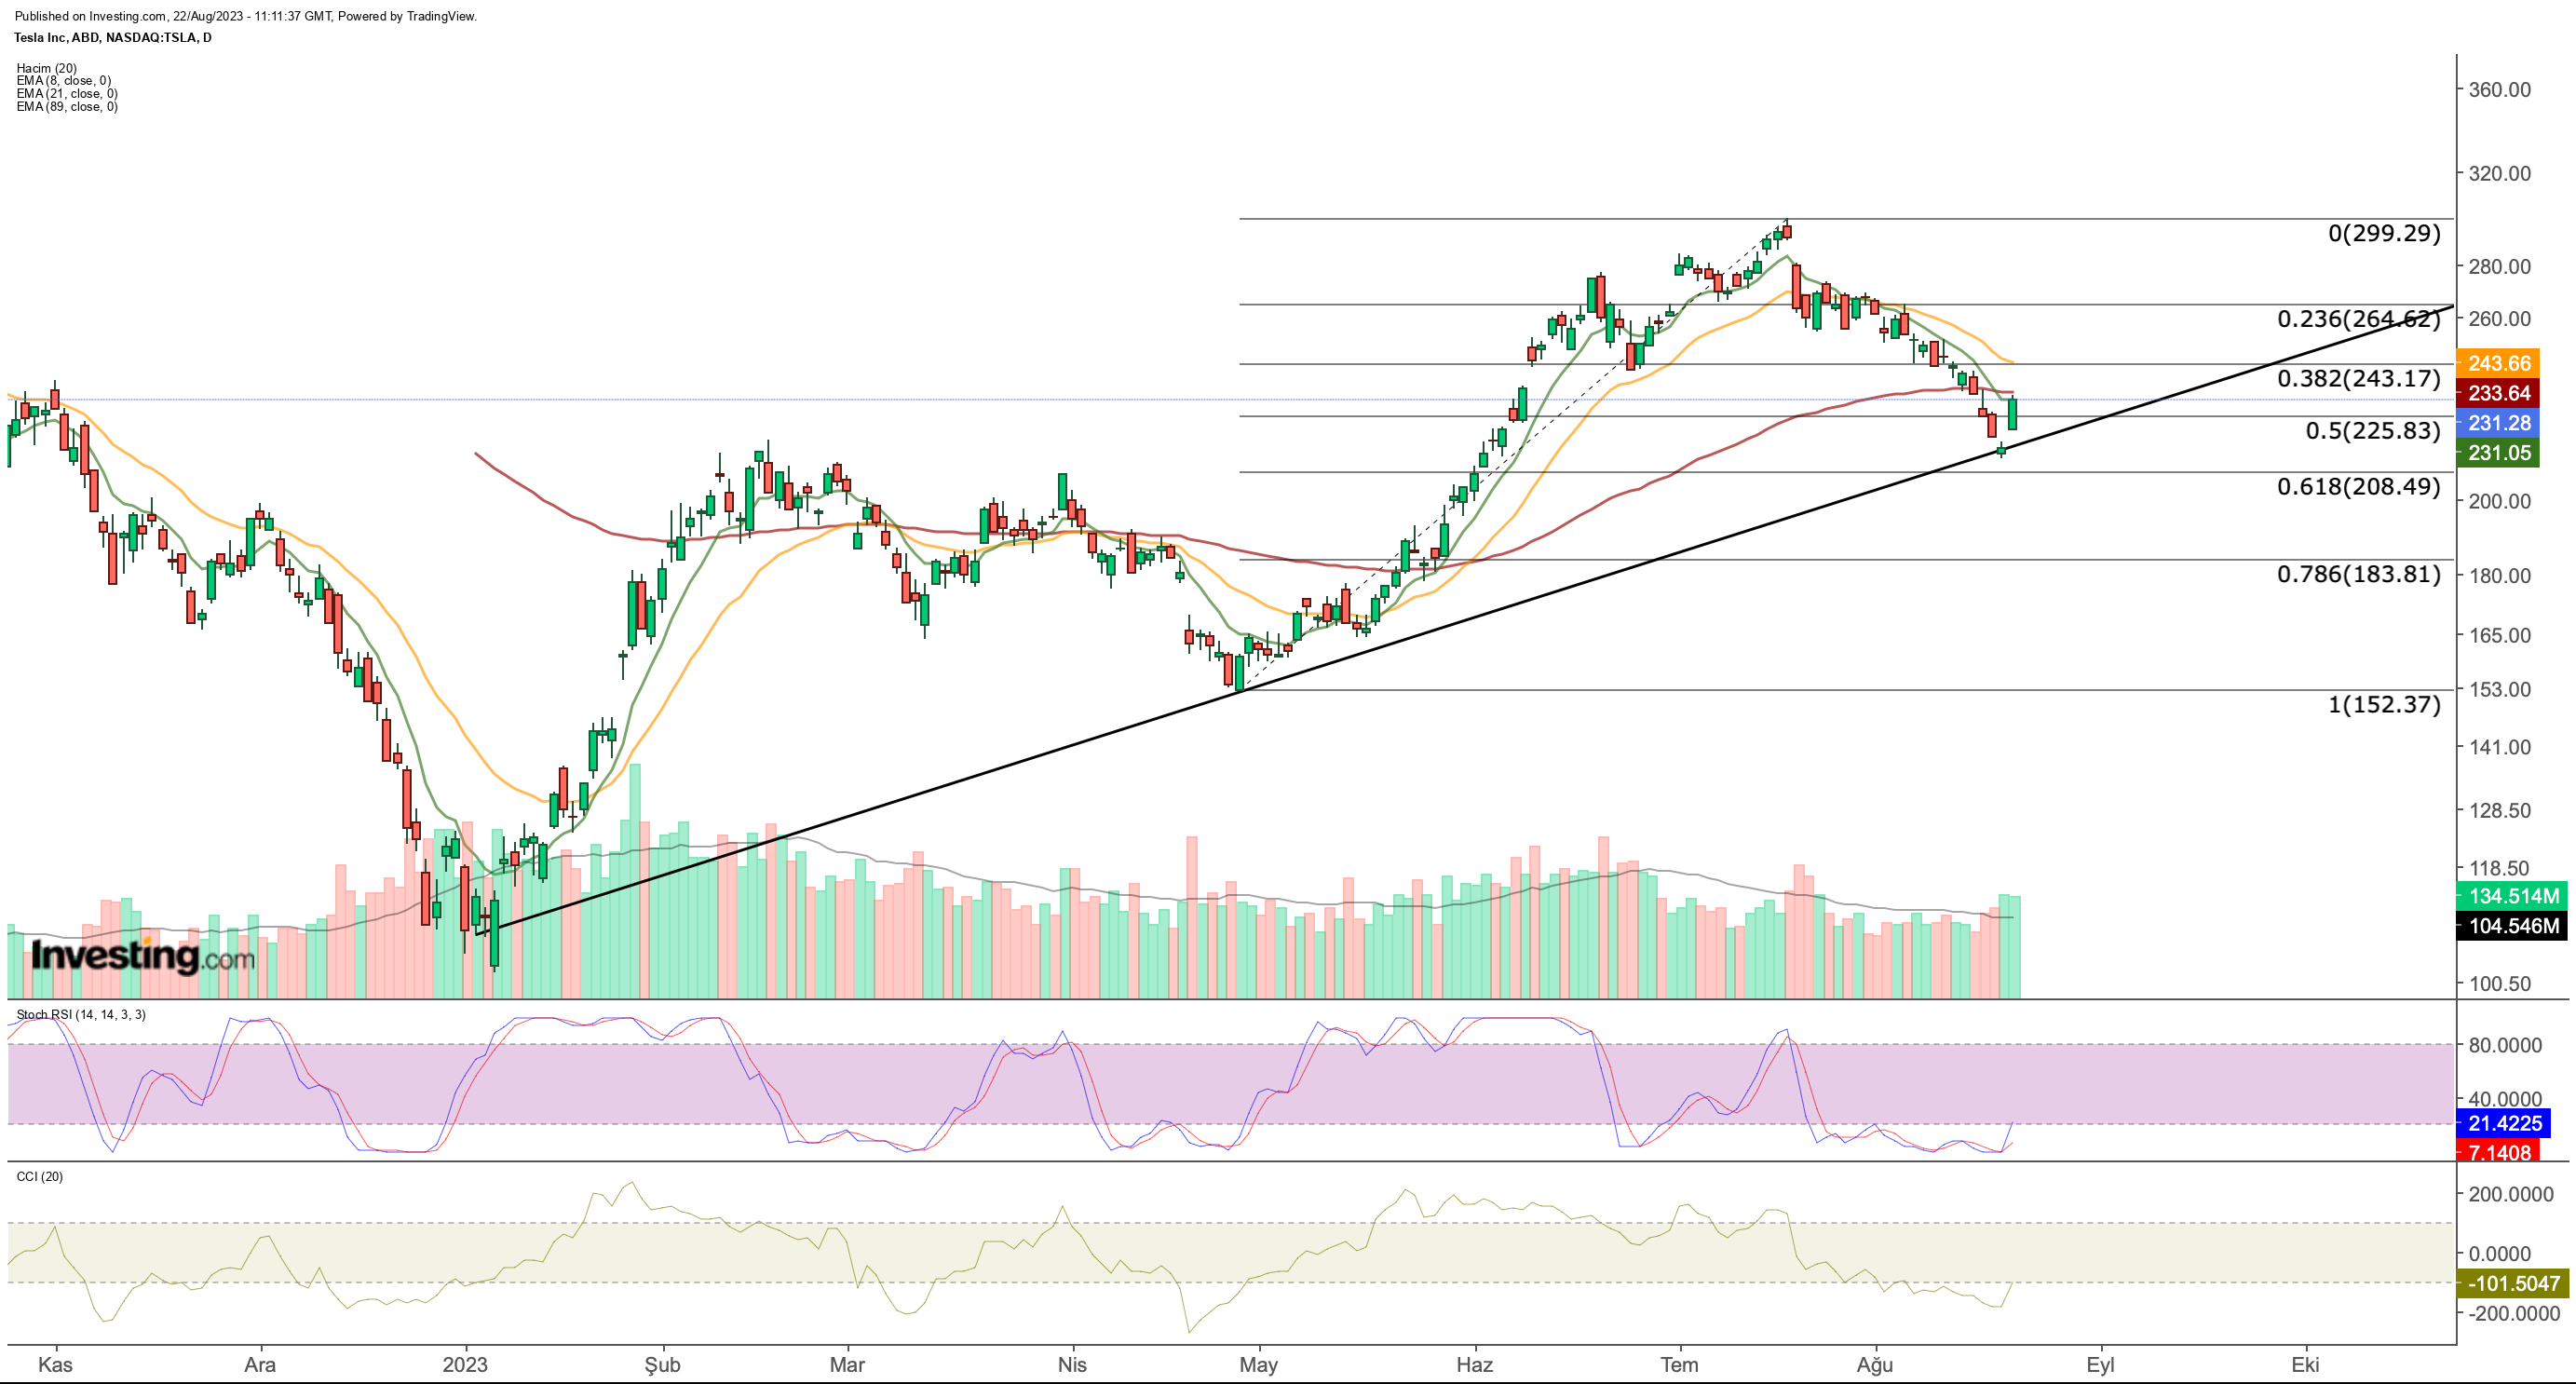
Tesla stock, known for its high volatility, managed to break its downward trend in 2022 by finding support around $100 levels early this year.
Following this, the stock embarked on a recovery journey, reaching $300 on July 19 after a partial correction observed from February to April. Having gained almost 200% during this phase, TSLA underwent its second correction of the year over the past month.
 As the stock begins this week with a notable leap in demand, a significant point to consider is how the year 2023 corresponds to a meaningful level, aligning with the rising trend line.
Notably, this support point holds importance as it coincides with the ideal Fib 0.618 correction zone. Interestingly, following the bullish movement after the initial correction, which concluded in April, TSLA’s price remained above the Fib 0.618 value, approximately $210.
Looking ahead, smoothly crossing the range of roughly $245 – $250 is crucial for sustaining the upward momentum. Beyond this threshold, it’s likely that the price will remain above the short-term EMA values, potentially propelling the upward trajectory.
Such momentum could empower TSLA to surpass its previous peak of around $300 and establish a new high within the $320 – $345 range in the final quarter of the year.
Moreover, the Stochastic RSI, which has hovered in the oversold zone, took a swift upward turn with yesterday’s bounce. If this indicator holds ground above the 20 levels, it technically supports the notion of an ascent.
For TSLA, the $235 level could be identified as a nearby resistance before the $245 – $250 range. Failing to surpass this resistance zone this week might reinforce the idea of ongoing correction momentum.
In the event of selling pressure, the average of $210 would serve as the nearest support in the lower range. In the case of a breach, a decline to the $180 area could be envisaged.
***

Find All the Info you Need on InvestingPro!
Disclaimer: The author does not own any of these shares. This content, which is prepared for purely educational purposes, cannot be considered as investment advice.


