Tesla Q2 Earnings Preview: Can Musk Keep Momentum Going Amid Higher Expectations?
2024.07.23 10:15
- Tesla stock has continued its uptrend in July, rebounding from a sluggish start to 2024.
- The company delivered more vehicles in Q2 than Q1 with deliveries outpacing production.
- Analysts’ forecasts for Tesla’s earnings are mixed, but the stock price could be volatile after the report.
- Unlock AI-powered Stock Picks for Under $8/Month: Summer Sale Starts Now!
Tesla (NASDAQ:) faces the moment of truth when it reports earnings tonight after the market close.
After a more than challenging first quarter, the EV giant has seen its stock rebound big time in Q2 on the back of several tailwinds.
Not only did the Musk-led company deviate from analyst predictions by delivering more vehicles than in Q1, but it also achieved record highs in energy storage products and benefitted from CEO Elon Musk’s hefty $56 billion compensation package. Notably, this last development helped ease concerns about the company’s commitment to robotics technology.
Tesla has been an integral part of our AI-powered stock pick strategy since the beginning of this month – a period during which it rallied a massive 27%.
But what if I told you we have other lesser-known picks that rallied just as much as Tesla this month?
Subscribe now for less than $8 a month as part of our summer sale and see all our picks for this month!
Tesla Stock Poised for Post-Earnings Volatility
Fueling the pre-earnings bullishness, Elon Musk made a surprising announcement yesterday by revealing that Tesla’s humanoid robots will begin production next year, with external sales slated for 2026.
Previously, Musk had anticipated these robots joining production by the end of 2024. Despite the delay, the news sent TSLA soaring 5% yesterday, propelling it back above the $250 range and it continues its July rally.
Against this backdrop, analysts’ forecasts for Tesla’s second-quarter earnings paint a mixed picture. Over the past three months, an equal number of analysts (13) have both raised and lowered their EPS estimates, resulting in a current consensus forecast of $0.62 per share.
Similarly, the revenue estimate sits at $24.74 billion.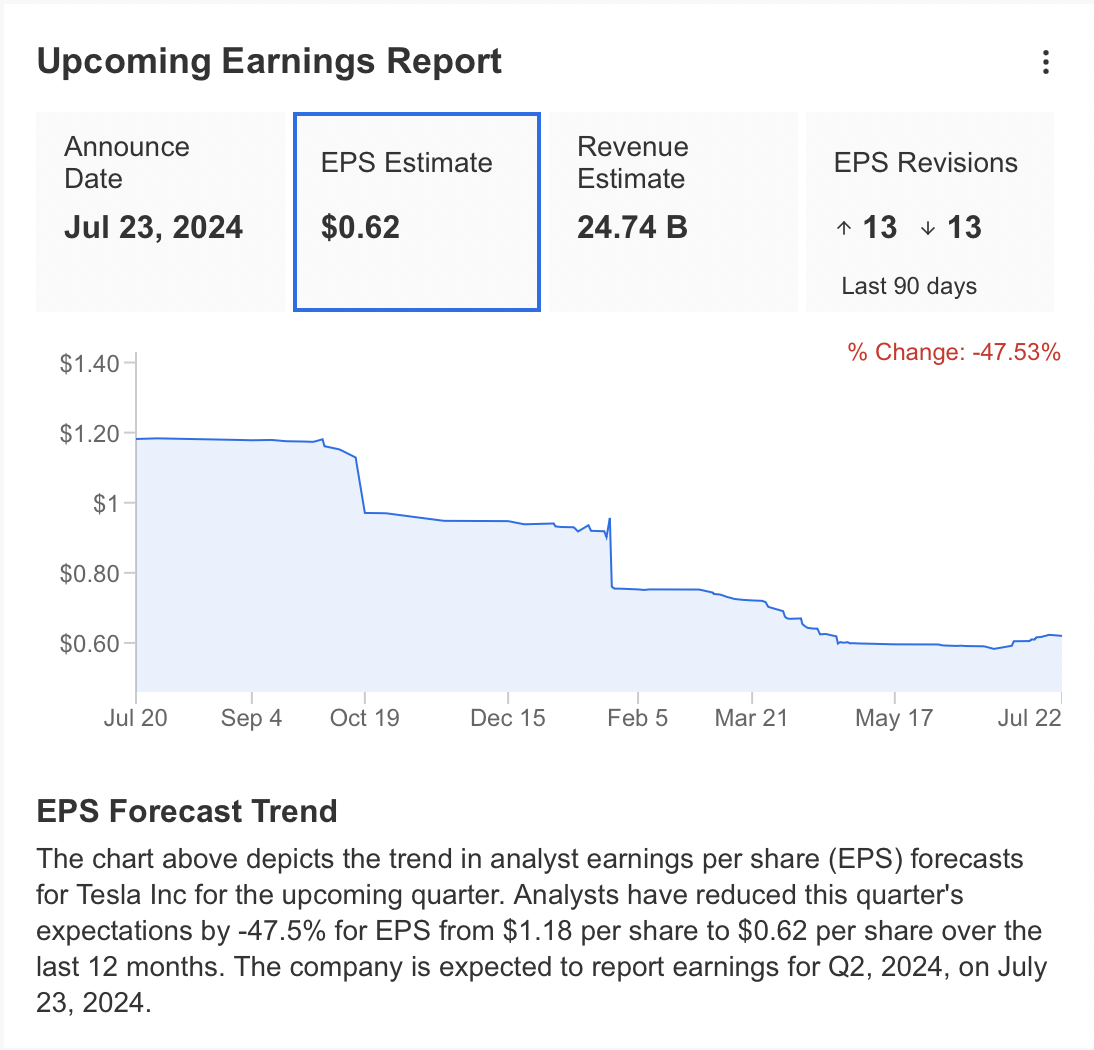
These figures represent significant downward revisions from initial expectations. Before adjustments, analysts predicted EPS of $1.18 and revenue of $31.55 billion. History suggests Tesla’s stock price might be volatile after the earnings report. Since 2022, share prices have typically fluctuated by more than 10% following quarterly reports.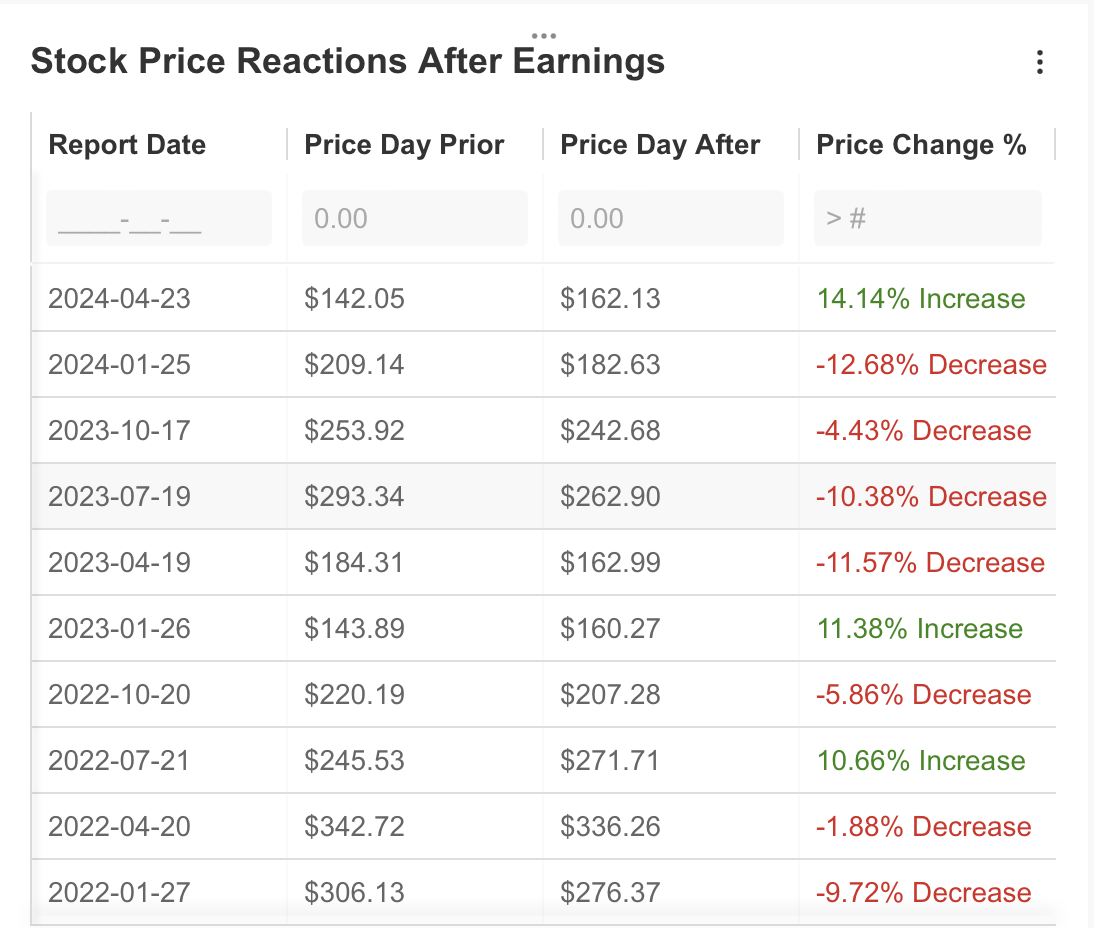
Looking beyond the immediate future, analysts predict a decline of up to 18% in Tesla’s EPS by year-end. However, the long-term outlook remains positive, with average annualized growth forecasts of 30%. Revenue is expected to follow a similar trend, with low growth of around 3% this year but a long-term expectation of close to 20% growth.
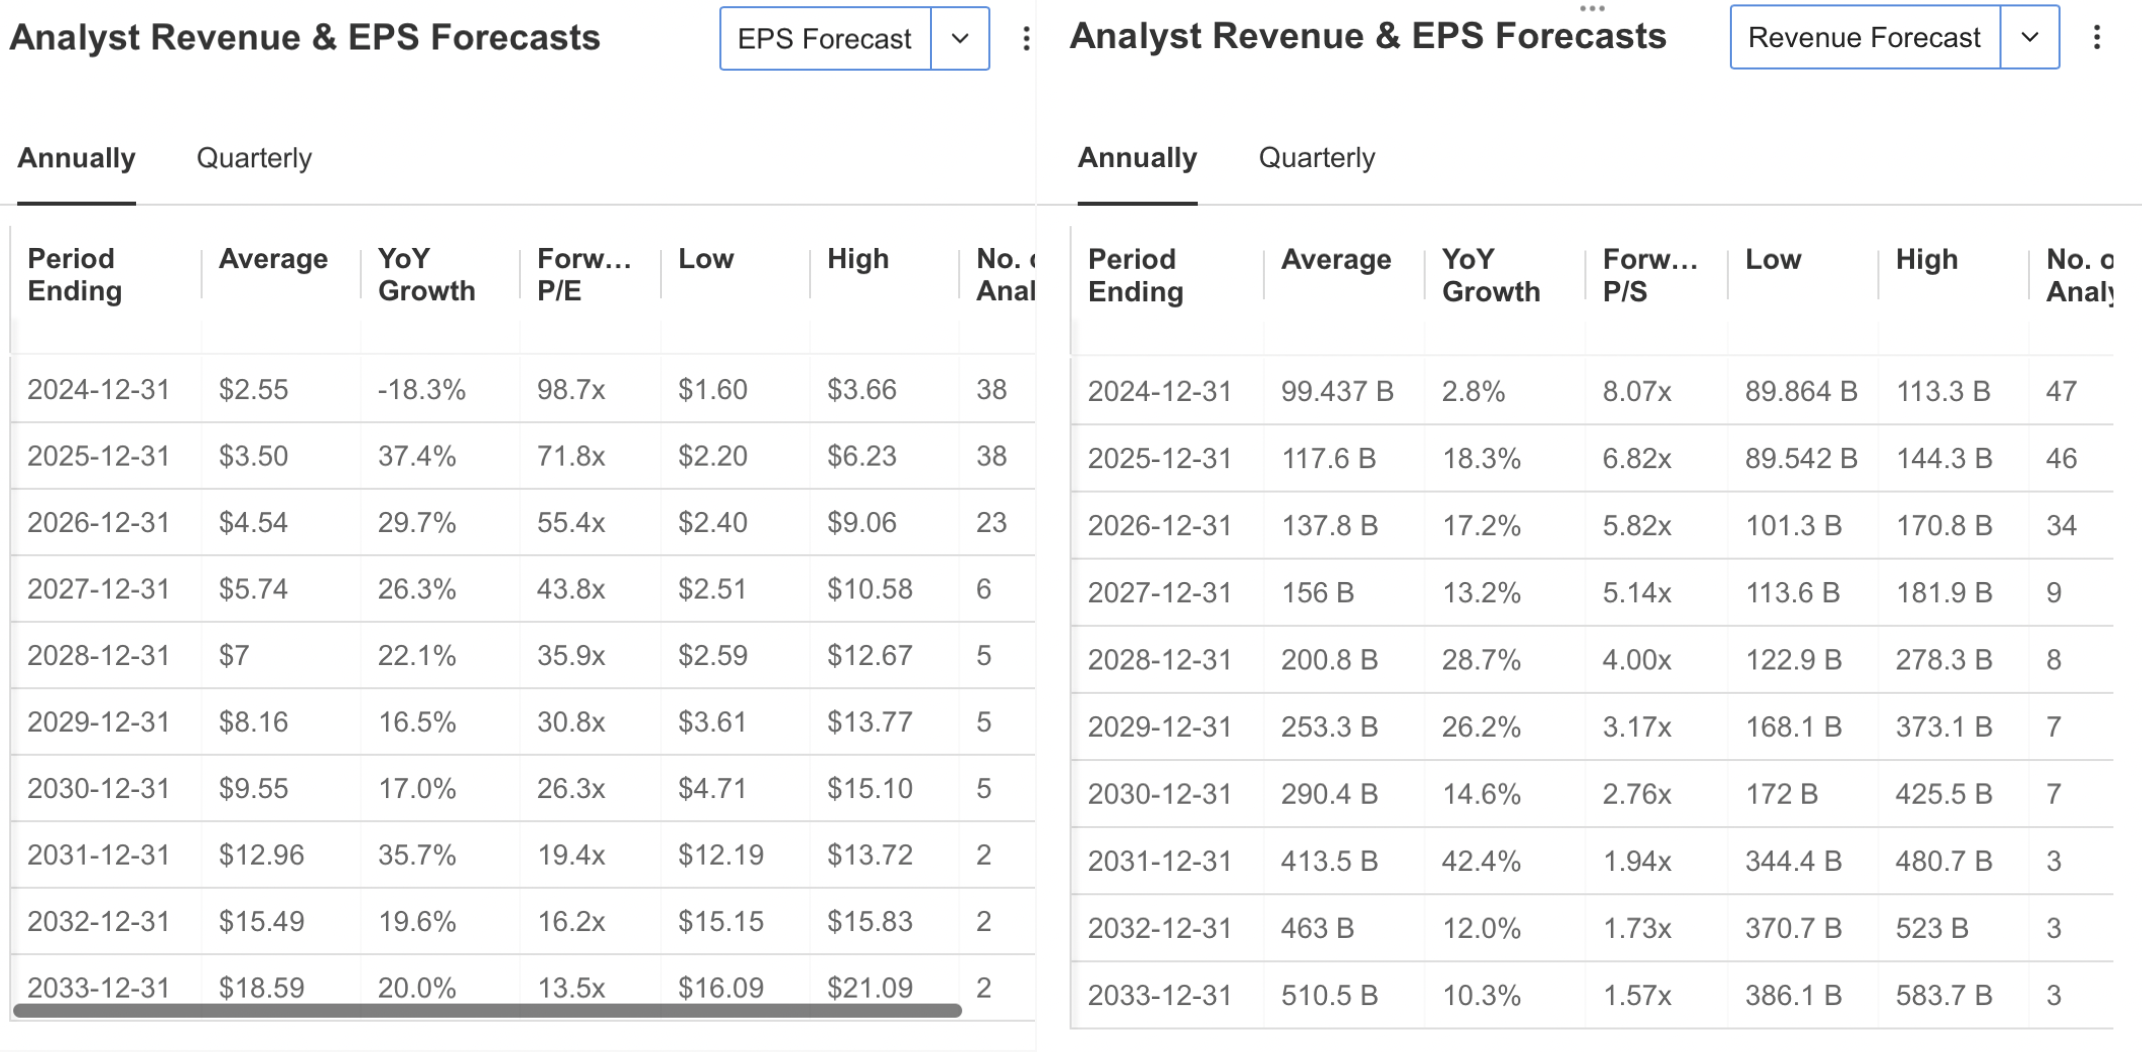
Tesla’s discount campaigns to boost sales volume are likely a contributing factor to the lower short-term revenue forecast.
Technical View
The upcoming Q2 earnings report could trigger an upward breakout if the stock crosses over the $265 level, but several factors create uncertainty.
Even with a strong top-and bottom-line, the market might have already priced in past excitement regarding the Robotaxi launch, especially considering its postponement. If the earnings report lacks a significant surprise announcement, it could lead to selling pressure, potentially causing a price drop.
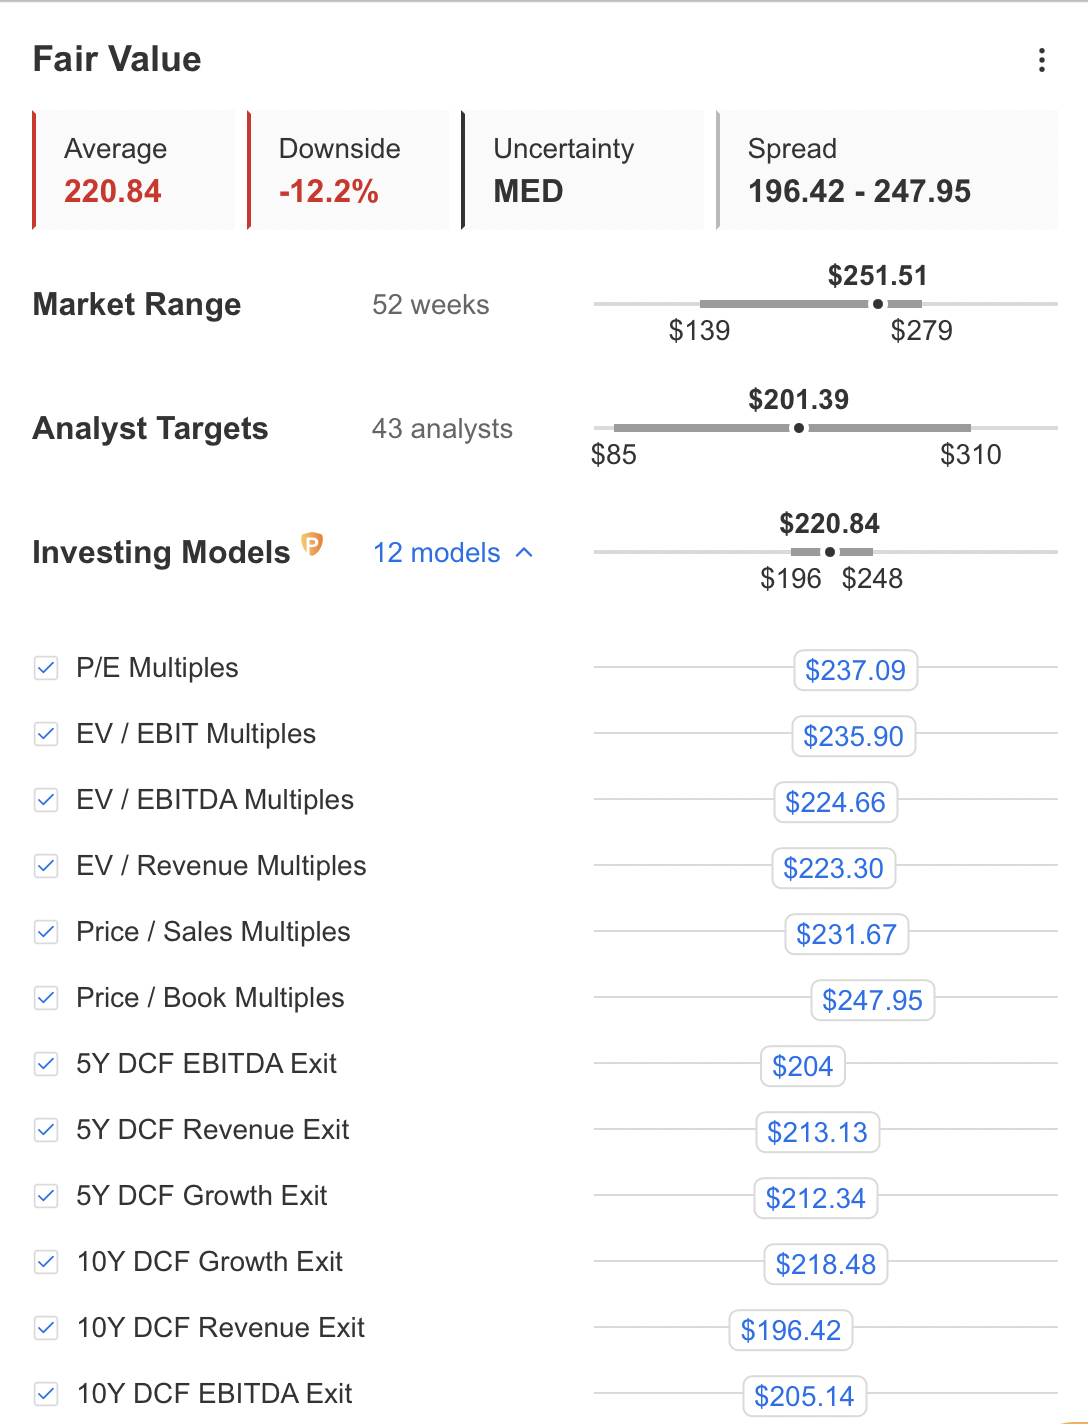
Fair value analysis using InvestingPro’s tools suggests a possible correction for TSLA. The average forecast predicts a 12% decline, with a fair price estimated at $220.84 based on various financial models. The highest analyst estimate sits at $247.95, while some models predict a price below $200 due to long-term revenue outflow concerns.
The overall analyst consensus estimate of $201 also falls short of the fair value calculation, indicating a potential downward trend for TSLA.
Tesla has been caught in a tug-of-war between support and resistance in July. Our previous analysis identified resistance at $265, which the stock failed to break decisively. Since then, TSLA has tested support at $238 twice, highlighting this price point as a potential floor.
The upcoming earnings report could be the catalyst for a breakout. Positive results and optimistic outlooks could propel the price above $265, potentially triggering a rise towards $300 in the short term.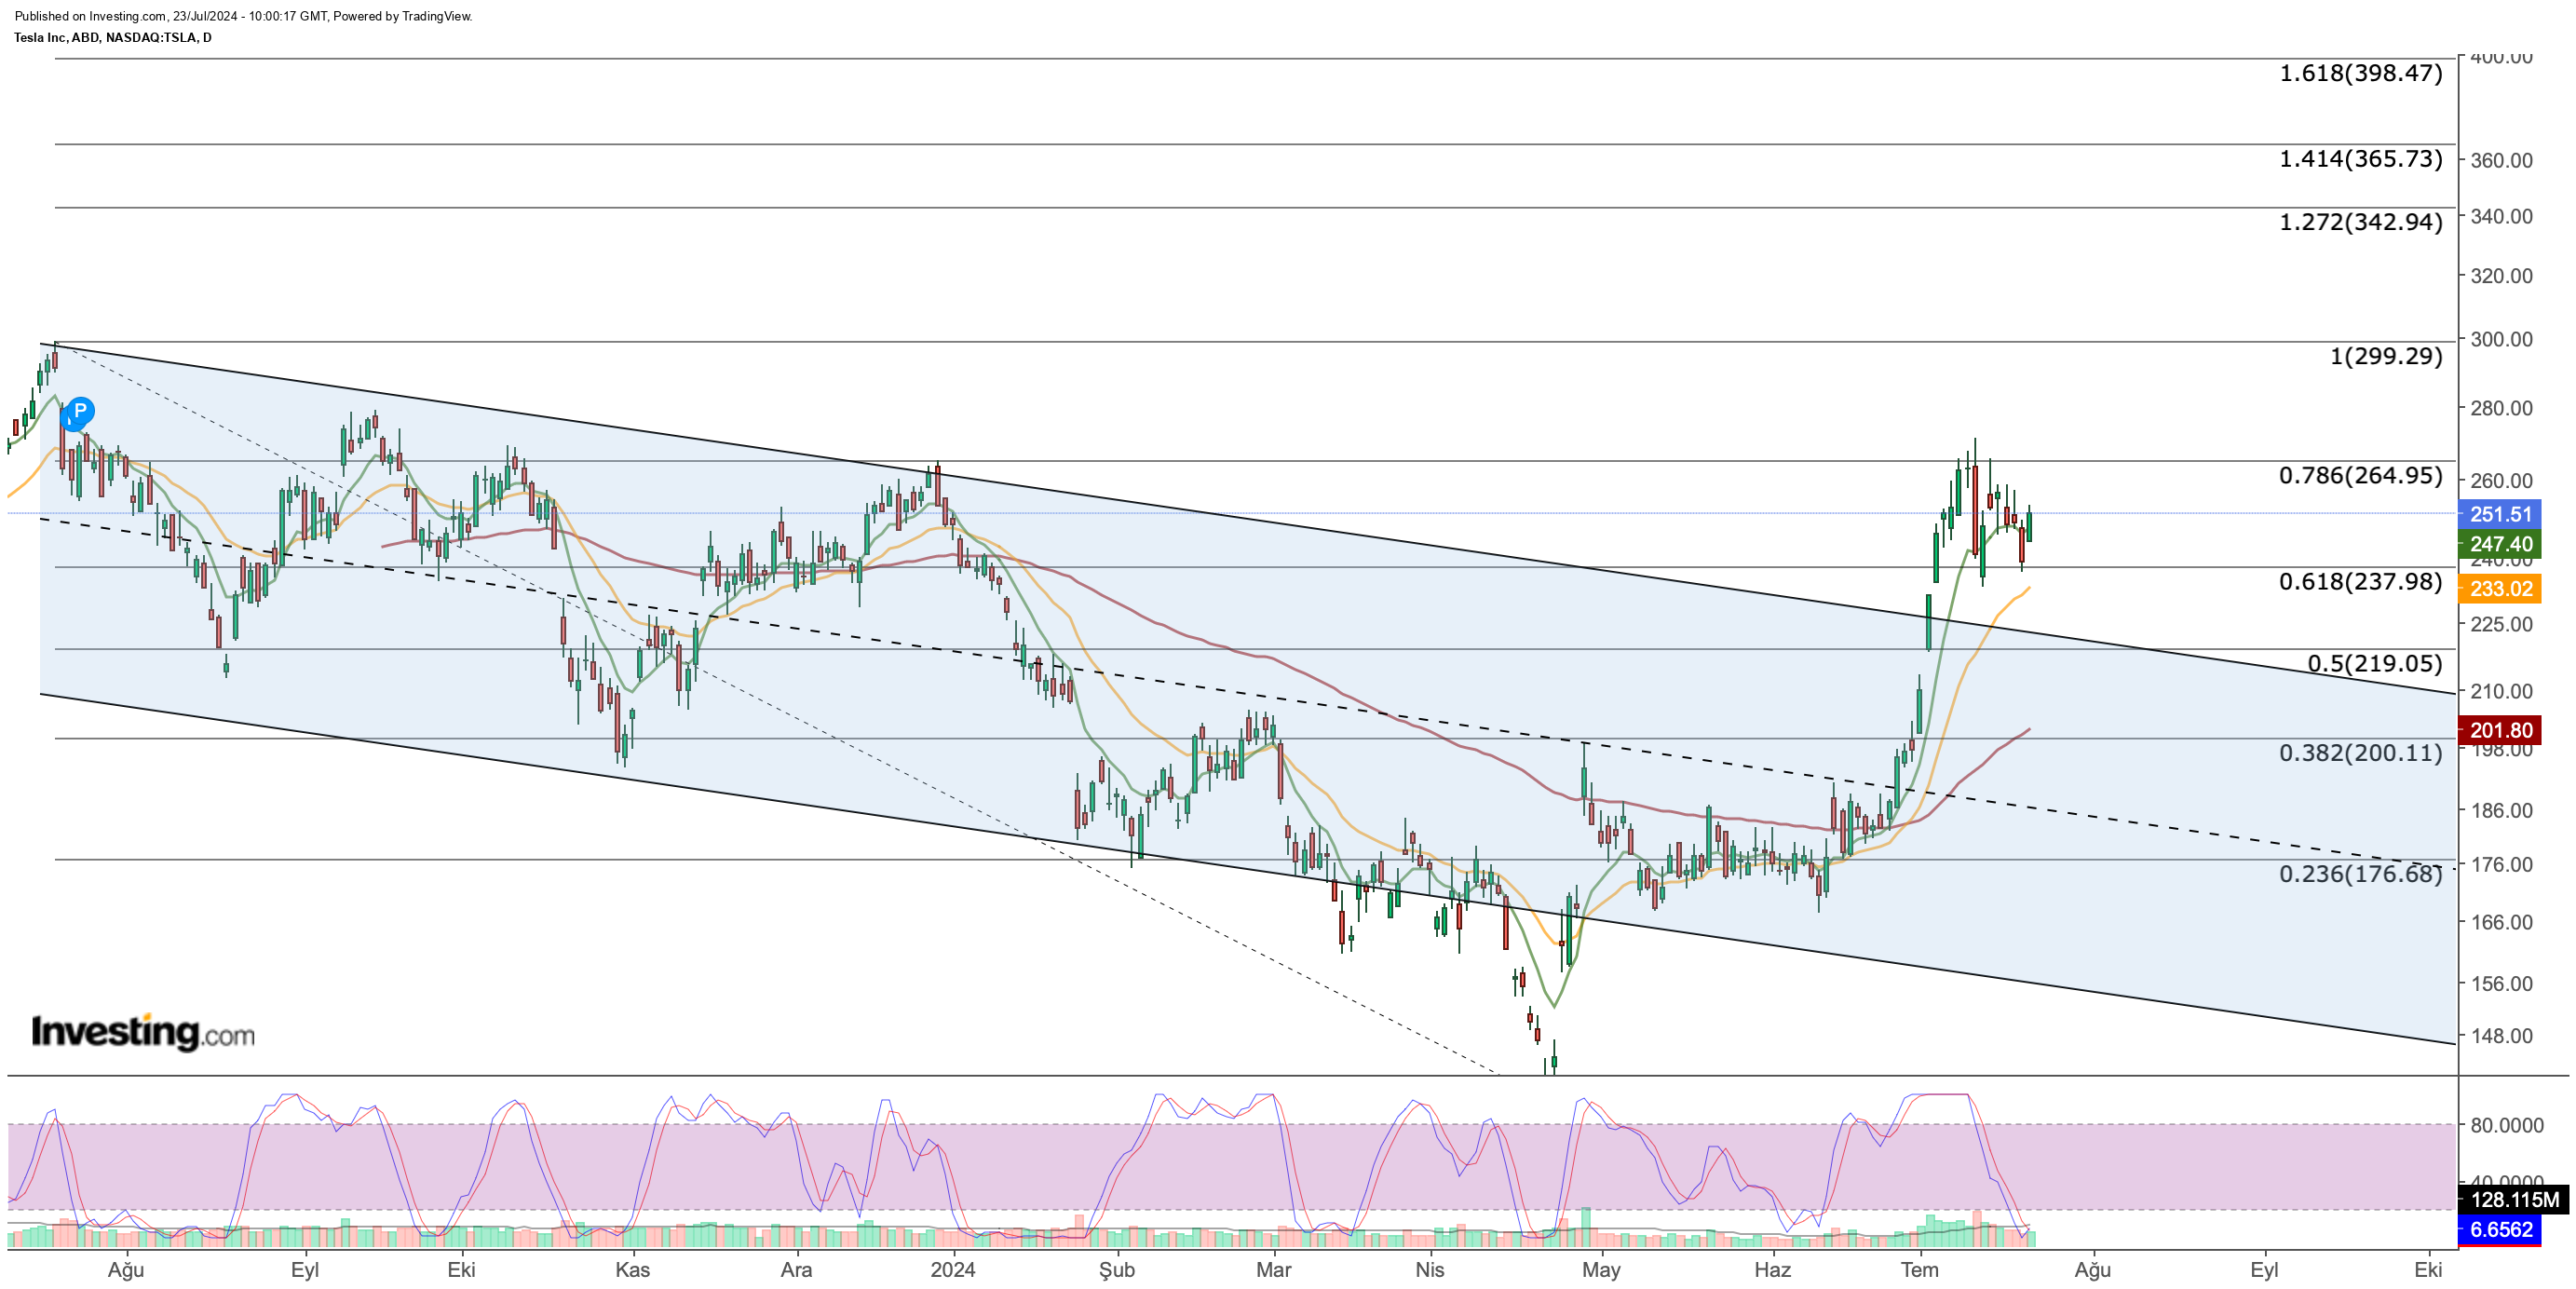
However, if the earnings report disappoints, a break below $238 support is a possibility. This could lead to a decline towards $220, a level that coincides with the upper band of the falling channel on the chart.
The Stochastic RSI indicator on the daily chart offers another clue. It has dipped into oversold territory, suggesting that a bounce could be imminent. If the price holds at $238 and the Stochastic RSI starts to rise, it could be a strong signal for an upward move.
In short, keep an eye on these key levels:
- Resistance: $265
- Support: $238
The earnings report and the Stochastic RSI could provide additional guidance on TSLA’s next move.
***
This summer, get exclusive discounts on our subscriptions, including annual plans for less than $8 a month!
Tired of watching the big players rake in profits while you’re left on the sidelines?
InvestingPro’s revolutionary AI tool, ProPicks, puts the power of Wall Street’s secret weapon – AI-powered stock selection – at YOUR fingertips!
Don’t miss this limited-time offer.
Subscribe to InvestingPro today and take your investing game to the next level!

Disclaimer: This article is written for informational purposes only; it does not constitute a solicitation, offer, advice, counsel or recommendation to invest as such it is not intended to incentivize the purchase of assets in any way. I would like to remind you that any type of asset, is evaluated from multiple perspectives and is highly risky and therefore, any investment decision and the associated risk remains with the investor.


