Tech Rout? Consider These Beaten-Down Sectors for a Potential Soft Landing Play
2024.07.19 08:52
- A rate cut is now seen as almost certain in September.
- Amid the building anticipation, tech stocks have been faltering.
- This could be a good time to readjust your portfolio ahead of a potential soft landing.
- Unlock AI-powered Stock Picks for Under $8/Month: Summer Sale Starts Now!
worries are taking a backseat for investors as market dynamics shift and fresh opportunities emerge. The Federal Reserve’s stance is also changing, with an upcoming rate cut no longer seen as an emergency measure but a necessary adjustment.
Current policy is viewed as overly restrictive in the face of evolving economic conditions. As a result, a rate cut is in September.
Amid this, tech stocks have been faltering of late, with a rotation into other overlooked sectors seen in the first leg of the current pullback.
However, the second leg of the pullback has investors worried about a broader selloff. This correction could present an opportunity to add stocks from these ignored areas of the market.

Rate Cuts Don’t Always Precede Recession
In 2019, the Fed reversed course, cutting interest rates after raising them throughout the previous year. This shift came in response to a slowing economy, creating space for a more accommodative policy.
However, our collective memory tends to focus on the ’emergency’ rate cuts implemented just before recessions. We often mistakenly equate all rate cuts with impending economic downturns.

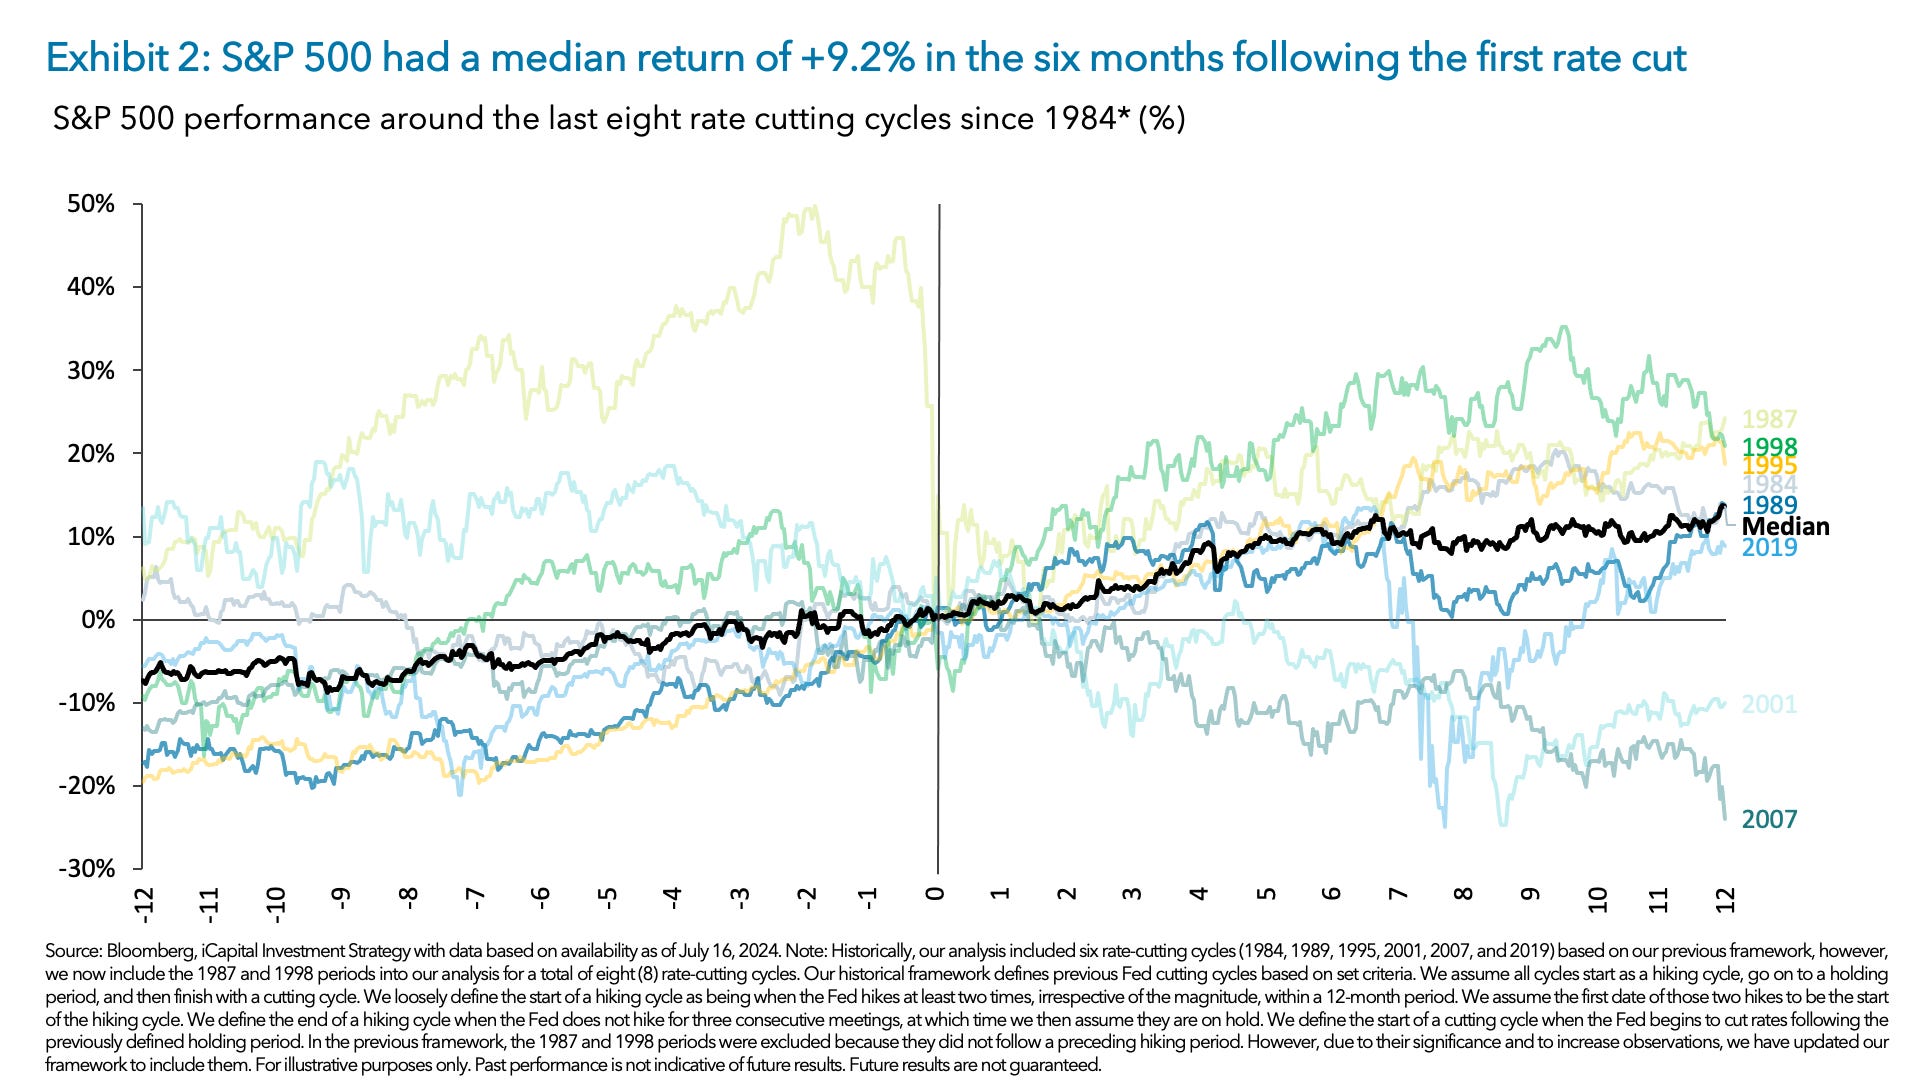
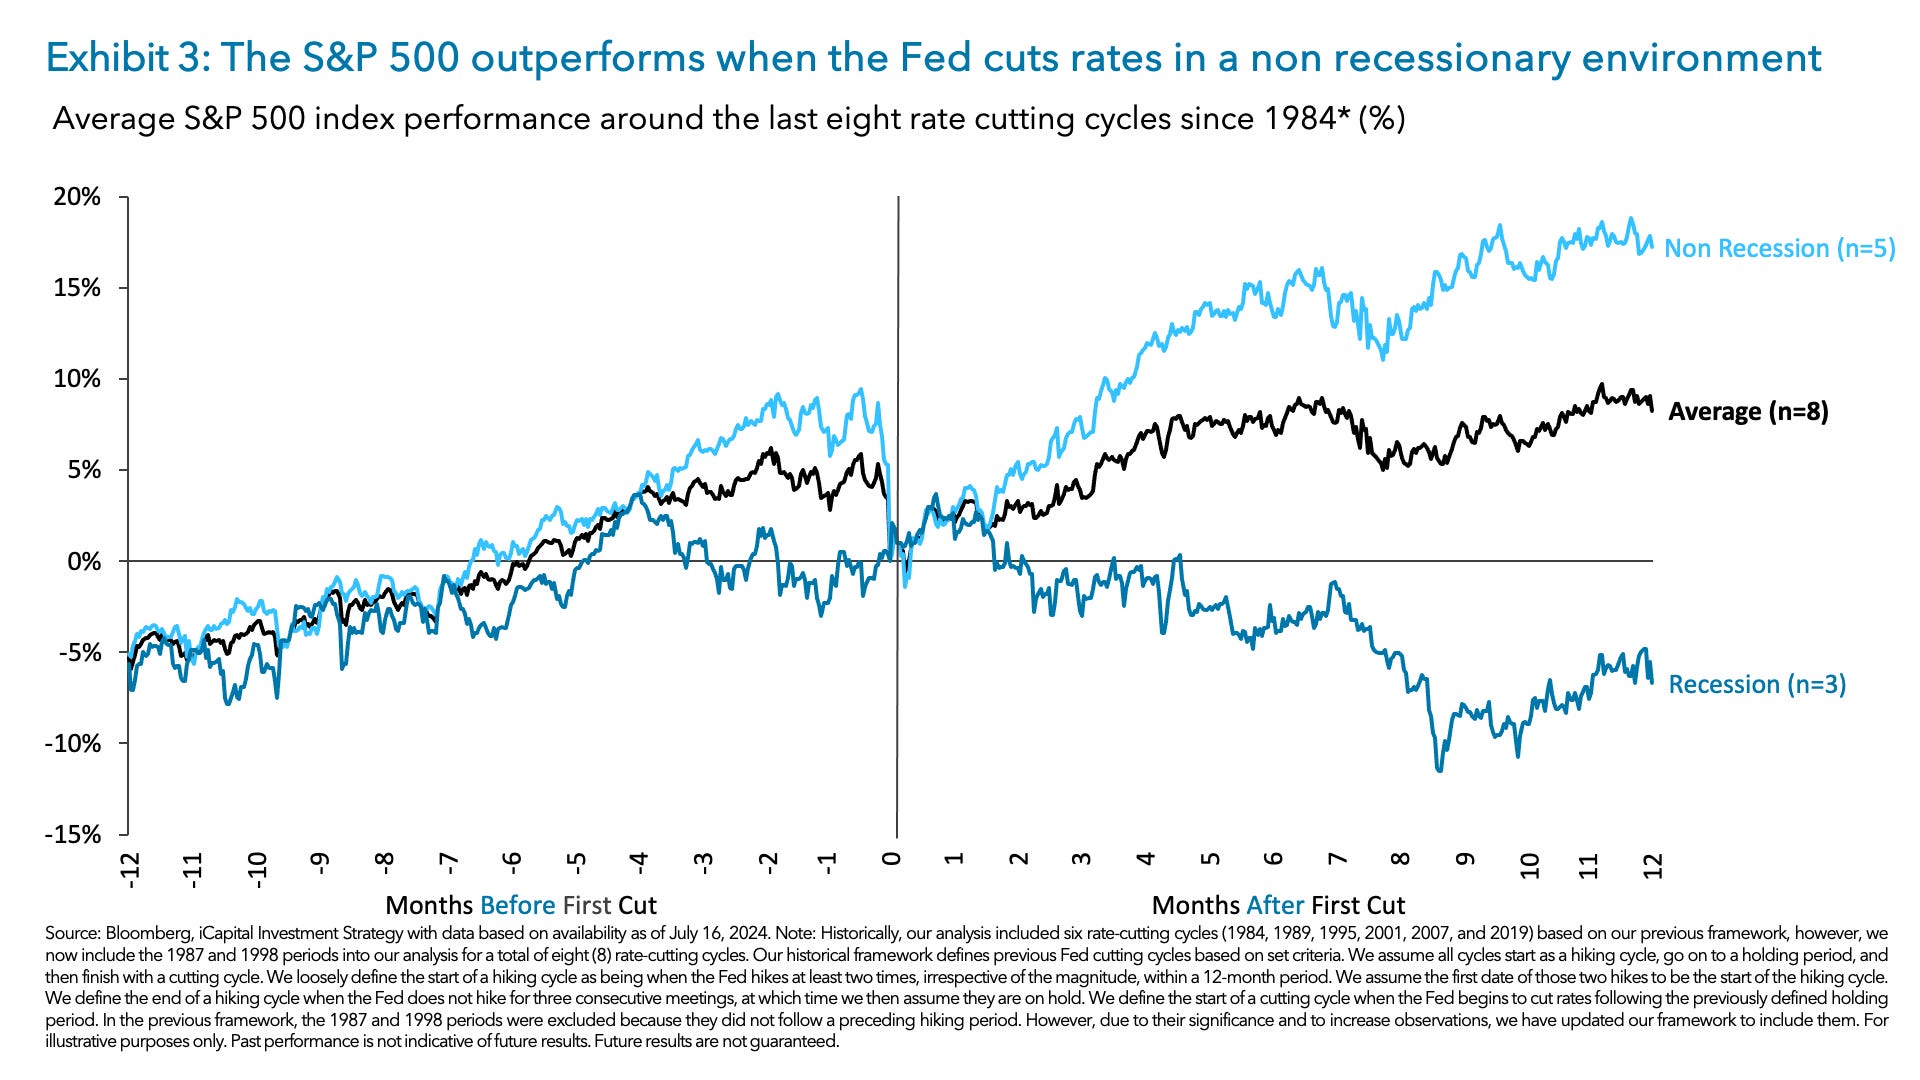
This graph plots the S&P 500’s performance (Y-axis, left scale) against the date of the first interest rate cut in a cycle (right scale) and the number of days following the cut (X-axis).
The data reveals a key takeaway: interest rate cuts aren’t synonymous with recession. While some cuts do coincide with recessions (red lines), many others (blue lines) occur without a downturn.
Fed Rate Cut on Horizon: Bullish Signal or Precursor to Trouble?
Looking ahead to the Fed meeting on July 31st, the graph offers valuable insights. Historically, equities, like the S&P 500, tend to rally in the 3-6 months leading up to the first rate cut (which aligns with our current situation).
After a short period of consolidation following the policy change, the market typically experiences an average return of 9-10% in the next 6-7 months.

Using historical data and assuming that the recession-free scenario materializes this year and in 2025, the market should continue to have a bullish trend.
However, the key question remains: will the Fed achieve a “soft landing” this time? A preemptive rate cut to maintain economic stability could support an uptrend for stocks. Conversely, a “hard landing” with a more aggressive rate hike would likely weigh negatively on equities.
Currently, the market appears to be navigating a period of consolidation and rotation. Given the potential for a soft landing, investors might consider reducing positions in the technology (NYSE:) and communications (NYSE:) sectors while increasing exposure to rate-sensitive sectors like real estate (NYSE:), small caps (NYSE:), and defensive sectors like utilities (NYSE:).
***
This summer, get exclusive discounts on our subscriptions, including annual plans for less than $8 a month!
Tired of watching the big players rake in profits while you’re left on the sidelines?
InvestingPro’s revolutionary AI tool, ProPicks, puts the power of Wall Street’s secret weapon – AI-powered stock selection – at YOUR fingertips.
Don’t miss this limited-time offer!
Subscribe to InvestingPro today and take your investing game to the next level!

Disclaimer: This article is written for informational purposes only; it does not constitute a solicitation, offer, advice, counsel or recommendation to invest as such it is not intended to incentivize the purchase of assets in any way. I would like to remind you that any type of asset, is evaluated from multiple perspectives and is highly risky and therefore, any investment decision and the associated risk remains with the investor.


