Summer auto plant shutdowns, Hurricane Beryl boost US weekly jobless claims
2024.07.18 15:53
By Lucia Mutikani
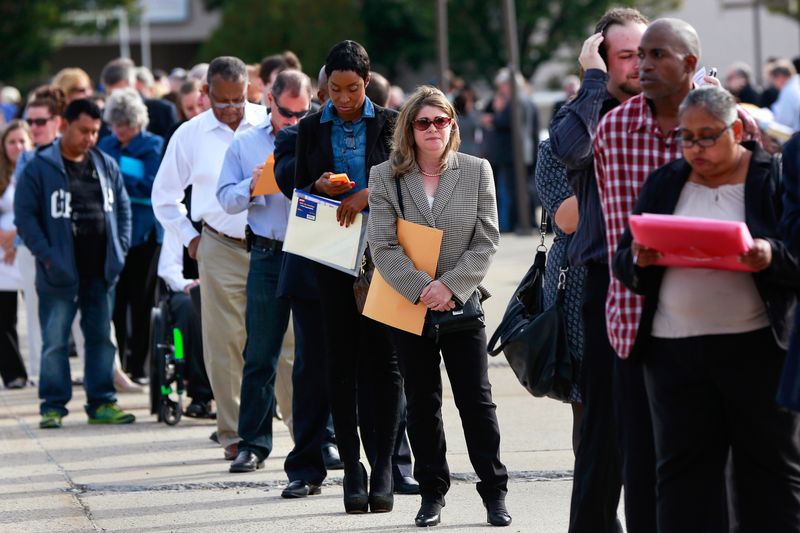
WASHINGTON (Reuters) – The number of Americans filing new applications for unemployment benefits increased more than expected last week, but that did not signal a material shift in the labor market amid temporary automobile plant closures and disruptions from Hurricane Beryl.
The weekly jobless claims report from the Labor Department on Thursday, however, suggested that it was getting harder for the unemployed to land new jobs relative to last year. Unemployment rolls swelled to the highest level in more than 2-1/2 years in the first week of July, in line with a recent increase in the jobless rate.
A loosening labor market and ebbing inflation position the Federal Reserve to cut interest rates in September, with financial markets anticipating additional cuts in November and December.
“Taking a step back from the noise in the data, jobless claims have drifted higher since the start of the year,” said Nancy Vanden Houten, lead U.S. economist at Oxford Economics. “We think the rise so far is consistent with a cooling labor market that is characterized more by a slower pace of hiring rather than by higher layoffs.”
Initial claims for state unemployment benefits increased 20,000 to a seasonally adjusted 243,000 for the week ended July 13, the Labor Department said on Thursday. Economists polled by Reuters had forecast 230,000 claims for the latest week.
The rise pushed claims back to a 10-month high touched in early June and right to the upper end of their 194,000-243,000 range for the year. It wiped out the drop in the prior week, which was attributed to difficulties adjusting the data around holidays, like the U.S. Independence Day.
In addition, auto makers typically shut down assembly plants starting the July 4 week to retool for new models. But the shutdown schedules are different for every manufacturer, which can throw off the model that the government uses to smooth out the data for seasonal fluctuations. Plant shutdowns were also more concentrated this year relative to prior years.
Claims rose in July last year through the first half of August, before fully reversing course by early September.
“Nonetheless, given the Fed’s increased focus on the labor market, and given the rise in the unemployment rate already reported through June, the trend in jobless claims should be closely watched,” said Conrad DeQuadros, senior economic advisor at Brean Capital.
Stocks on Wall Street were trading higher. The dollar rose against a basket of currencies. U.S. Treasury prices fell.
HURRICANE IMPACT
Unadjusted claims jumped 36,824 to 279,032 last week. Filings surged 11,537 in Texas, likely boosted by Hurricane Beryl. They advanced 6,917 in California.
There were sizeable increases in Georgia, Missouri, New York, Pennsylvania and South Carolina. Applications also rose in Kentucky, Kansas, Alabama and Ohio. Most of these states have motor vehicle assembly plants. The increases more than offset declines New Jersey, Indiana and Massachusetts.
“Claims might remain elevated in Texas again this week, as retroactive claims are allowed in the event of a natural disaster and most people have more important concerns when a storm is raging, but this boost will fade by next week,” said Ian Shepherdson, chief economist at Pantheon Macroeconomics.
The labor market is cooling as the U.S. central bank’s rate increases in 2022 and 2023 slow demand. The unemployment rate rose to a 2-1/2-year high of 4.1% in June.
The Fed’s “Beige Book” report on Wednesday showed “employment rose at a slight pace” from late May through early July, but noted a decline in manufacturing employment.
It said supply had improved and “labor turnover was lower, which reduced demand to find new workers,” adding that businesses “in several districts expect to be more selective on who they hire and not backfill all open positions.”
Factory employment could, however, stabilize in the months ahead. A survey from the Philadelphia Fed on Thursday showed manufacturing activity in the Mid-Atlantic region accelerating in July as new orders surged. Manufacturing employment also expanded for the first time in nine months.
The claims data covered the period during which the government surveyed business establishments for the nonfarm payrolls portion of July’s employment report. Claims increased slightly between the June and July survey weeks.
Nonfarm payrolls increased by 206,000 jobs in June.
Data next week on the number of people receiving benefits after an initial week of aid, a proxy for hiring, will shed more light on the state of the labor market in July.
The so-called continuing claims increased 20,000 to a seasonally adjusted 1.867 million during the week ending July 6, the highest level since November 2021.

The Fed has maintained its benchmark overnight interest rate in the current 5.25%-5.50% range for the past year. It has hiked its policy rate by 525 basis points since 2022.
“We learned from the recent Beige Book that businesses are not filling open positions as aggressively as they were in previous months,” said Jeffrey Roach, chief economist at LPL Financial (NASDAQ:). “We should expect more cautionary rhetoric from Fed policymakers about the labor market.”


