Strong Market Breadth Suggests Bull Market Still Has Room to Run
2024.05.03 08:54
Our tendency to focus on short-term retracements often overshadows the broader perspective on bull markets.
If the current bull market were to end today, it would be the shortest since the postwar period, ranking fourth last out of 13 bull markets in terms of total return since its inception (40.7%).
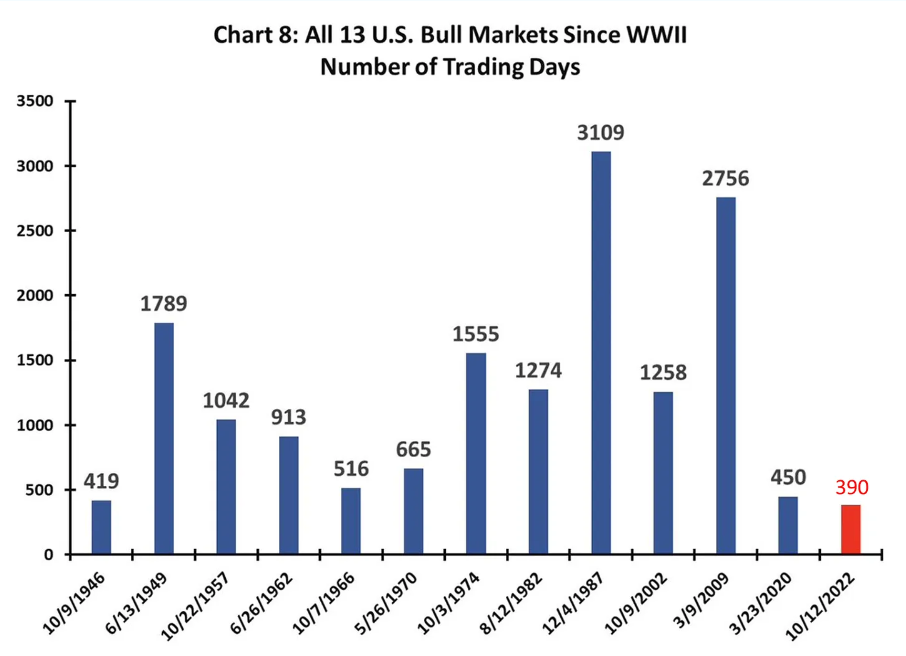
While the 2020 post-pandemic market holds the record for the strongest gains (+94.5%), the 1946 bull market saw the weakest performance, albeit still positive (+11%).
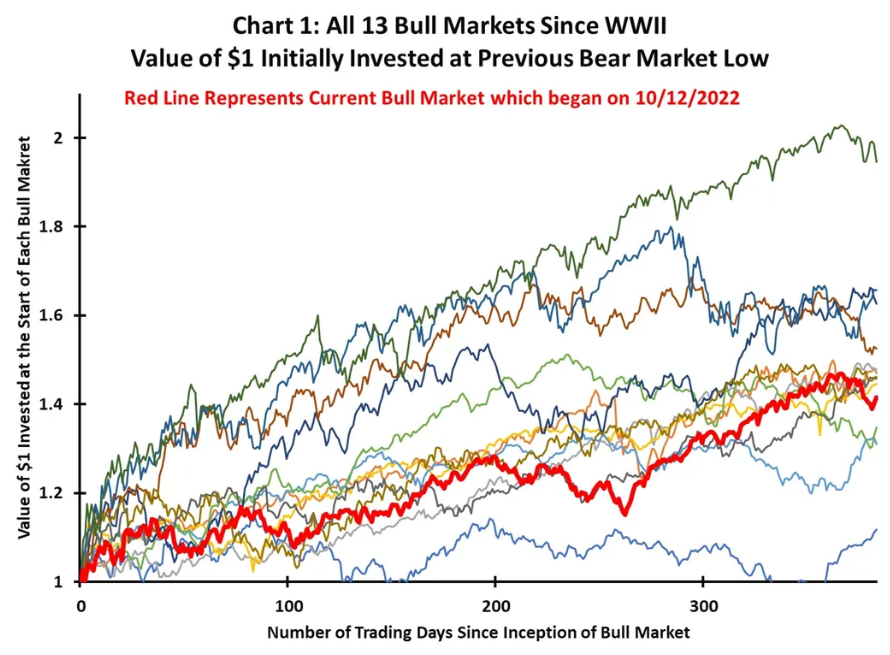
The red line in the chart above clearly shows the current bull market’s trajectory compared to other bull markets that began in December 2022. This shows that we’re operating in a completely different market environment compared to a year ago.
Other Sectors Set to Take Over From Tech Stocks?
In 2023, mega-cap growth stocks dominated the bull market, and simply riding that trend was the key to exceeding the market’s average performance.
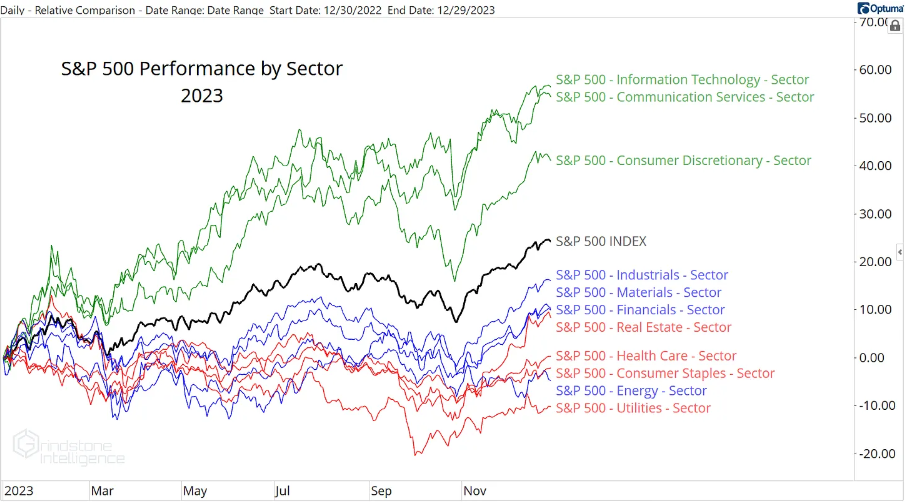
This is evident in the sector-wise chart, where the strong bullish trend of growth-oriented sectors stands out in blue, compared to the more subdued performance of value sectors (blue) and risk-off sectors (red).
However, the market narrative seems to have shifted decisively.
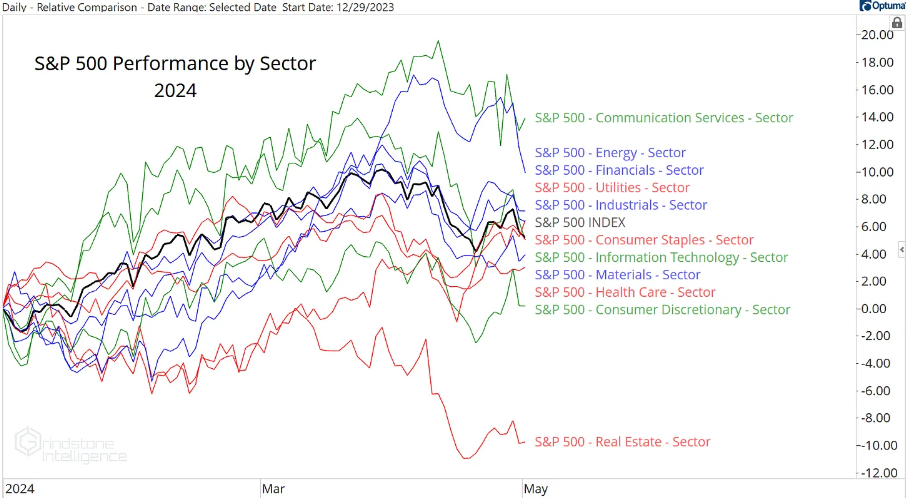
The new year has seen communication services surge, solidifying its position as a top performer. Real estate, on the other hand, continues to struggle, but a clear winner among the middle sectors remains elusive.
This indecisiveness within the market indicates a lack of consensus on which group will ultimately dominate.
Market Breadth Remains Strong
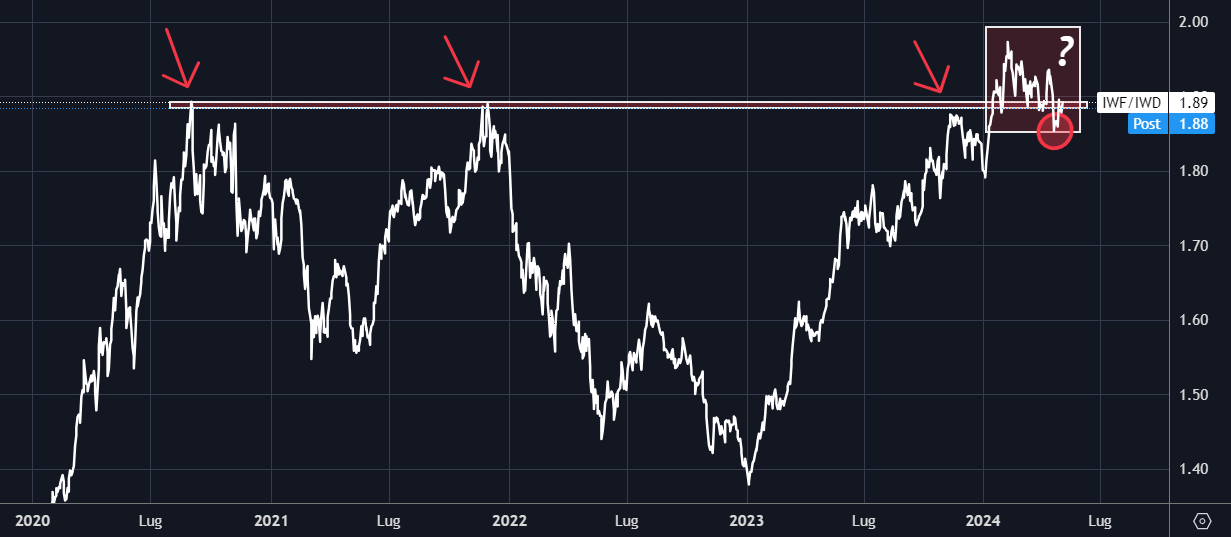
The growth (NYSE:) vs. value (NYSE:) ratio has been on an upward trajectory since September 2020, with attempts to break above the previous high in 2021 and 2023.
Finally, a breakout occurred late last year, and 2024 has seen consolidation above a key support level. Such consolidations often signal a continuation of the long-term trend, which in this case remains bullish.
While growth stocks are likely to continue outperforming in the long run, a short-term downward break could potentially foreshadow a shift in favor of value stocks.
However, before declaring a definitive bearish turn, we need to see a weakening in market breadth. This would manifest as a general market reversal, but currently, 58% of S&P 500 stocks remain above their 200-day moving average.
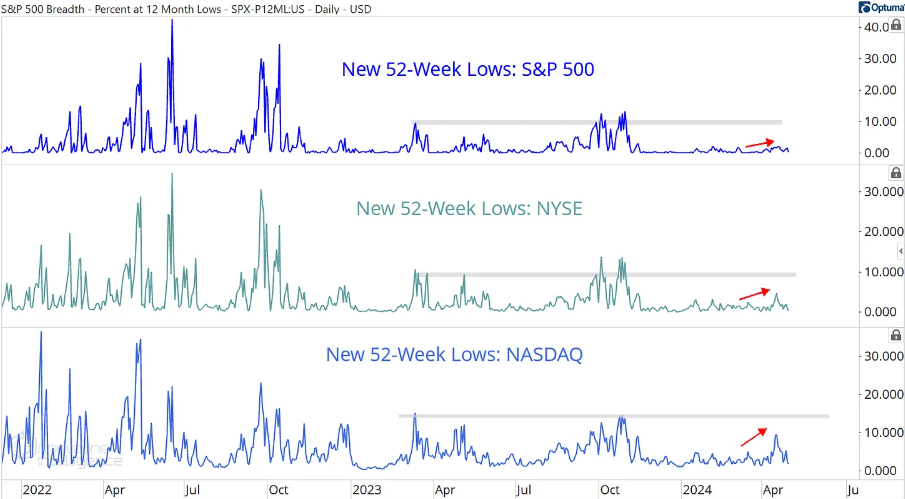
Additionally, the number of new lows is still below the levels seen in 2023, suggesting we haven’t entered a firm bear market yet.
***
Identify the next hot stocks with Fair Value or trust our AI ProPicks stock picks (and enjoy many other benefits) with InvestingPro!
Identify and build better-performing portfolios with InvestingPro, for only €8.1 per month thanks to our limited one-year subscription offer!
– Ready to analyze more stocks together? follow us in upcoming hands-on lessons, subscribe now with an additional DISCOUNT, CLICK HERE join the PRO Community.

Disclaimer: This article is written for informational purposes only; it does not constitute a solicitation, offer, advice, counsel or recommendation to invest as such it is not intended to incentivize the purchase of assets in any way. I would like to remind you that any type of asset, is evaluated from multiple points of view and is highly risky and therefore, any investment decision and the associated risk remains with the investor.
3rd party Ad. Not an offer or recommendation by Investing.com. See disclosure here or
remove ads
.
Source link


