S&P 500: Year-End Rally Elusive, But Some Sectors Could Still Shine
2023.10.23 06:26
- History suggests stocks tend to rally by the end of the year
- But this time, a rally remains uncertain considering the macroeconomic and geopolitical factors
- Still, even if the broader market doesn’t, some sectors could rally into the year-end
Is an end-of-year rally in the cards?
Historically, this is the typical seasonal trend in the market.
The year has been following this pattern so far. In early 2023, we witnessed seasonal strength, with the surging by over 20% in the first half. Then came the expected third-quarter weakness, which was well within the norm.
Now, we stand at the crucial juncture when stocks should initiate a new rally, at least in theory.
So, are we on the brink of a broader stock market rally now, or could that rally be in specific sectors considering the macroeconomic and geopolitical backdrop?
Let’s assess the latest market indicators for a better look at this question.
October Sees S&P 500 Stocks Struggle
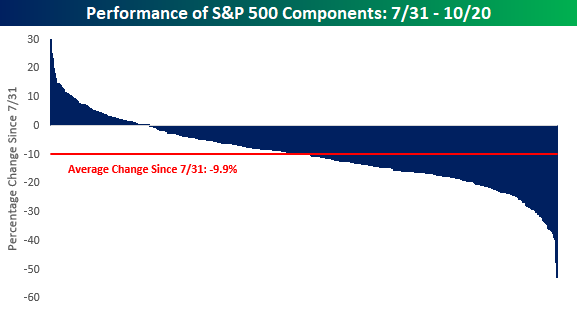
As we approach the last days of October, the average decline for individual components of the from their July highs is approximately -9.9%.
Many stocks have suffered even more significant declines.
While one out of every five stocks in the index has maintained a bullish trend during this period, 81 stocks have experienced drops of over 20%, and 166 stocks have fallen by a margin between 10% and 20%.

S&P 500 Components Performance
Can Energy Stocks Stage a Year-End Rally?
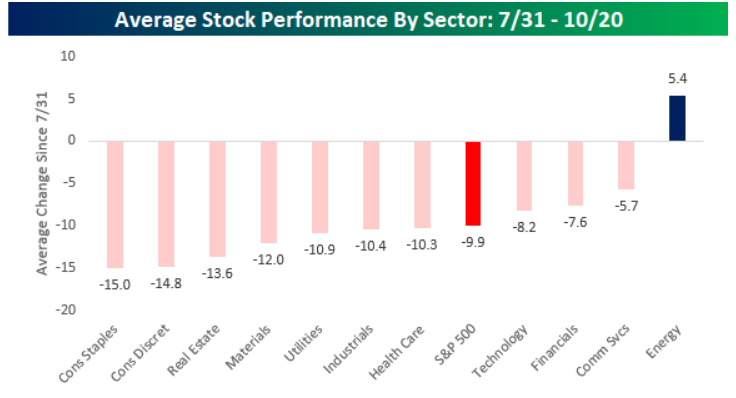
In terms of sectors, the largest average gains are found in the energy sector (NYSE:) with +5.4% (the communications (NYSE:), financial (NYSE:), and tech sectors (NYSE:) also held up relatively well compared to the index).
In fact, the chart below shows the energy sector as the only one where more than a third of the components are up.
 Average Stock Performance by Sector
Inflation Is Here to Stay
Those who thought inflation would go away would no longer bet on this sector but according to the bond market, inflationary pressures are probably only just beginning.
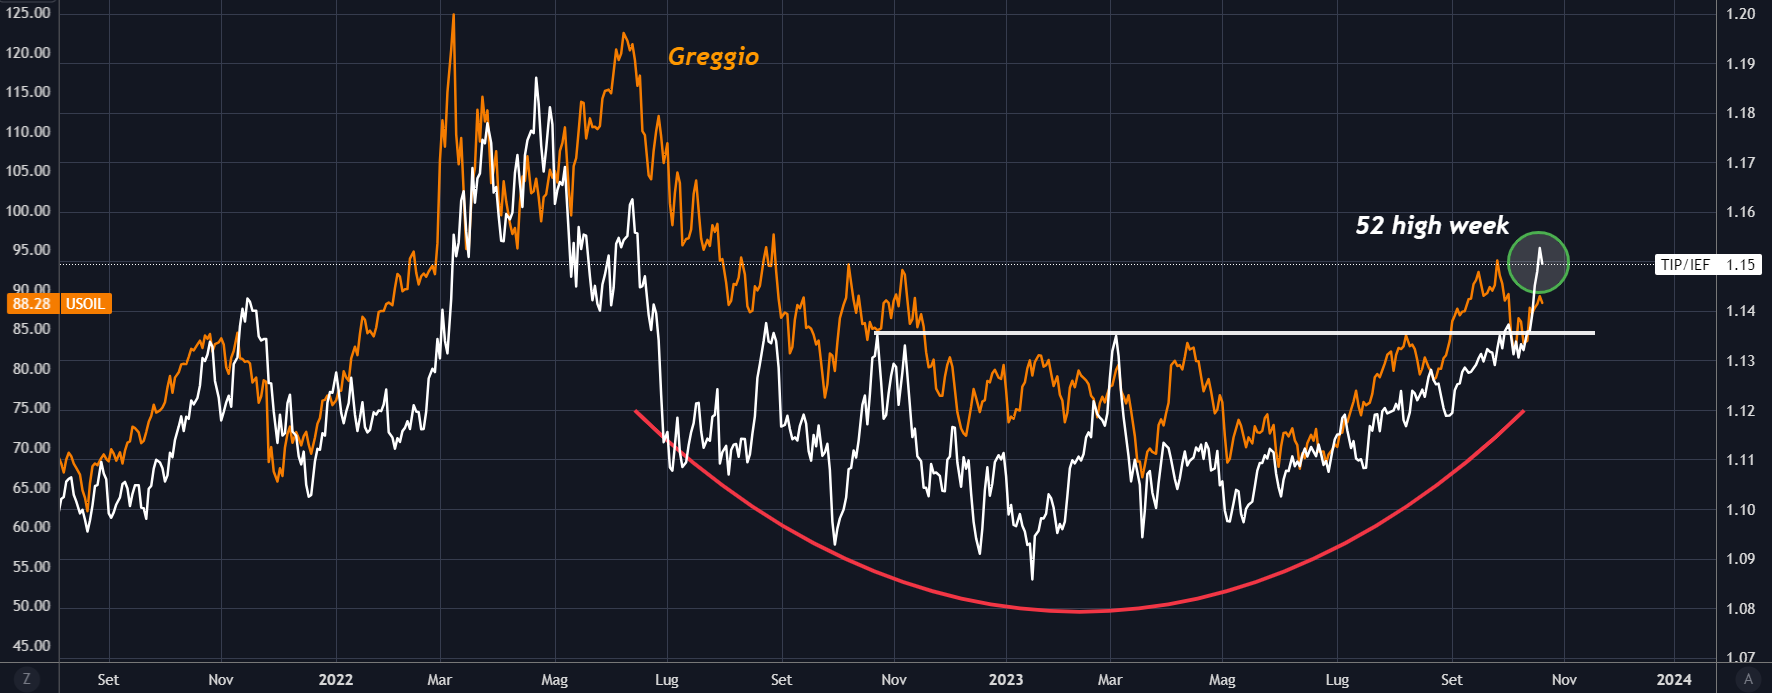
In fact, if we take a look at inflation-adjusted Treasury bonds (TIPs) compared with nominal yields (7-10 years) we will notice new annual highs, representing the bond market’s inflation expectations.

And adding to the ratio the trend of we can see how bond inflation expectations have a positive correlation.
Could Commodities Witness a Multi-Year Surge From Here?
Bullish trends in commodities historically last more than a decade (with Gold participating).

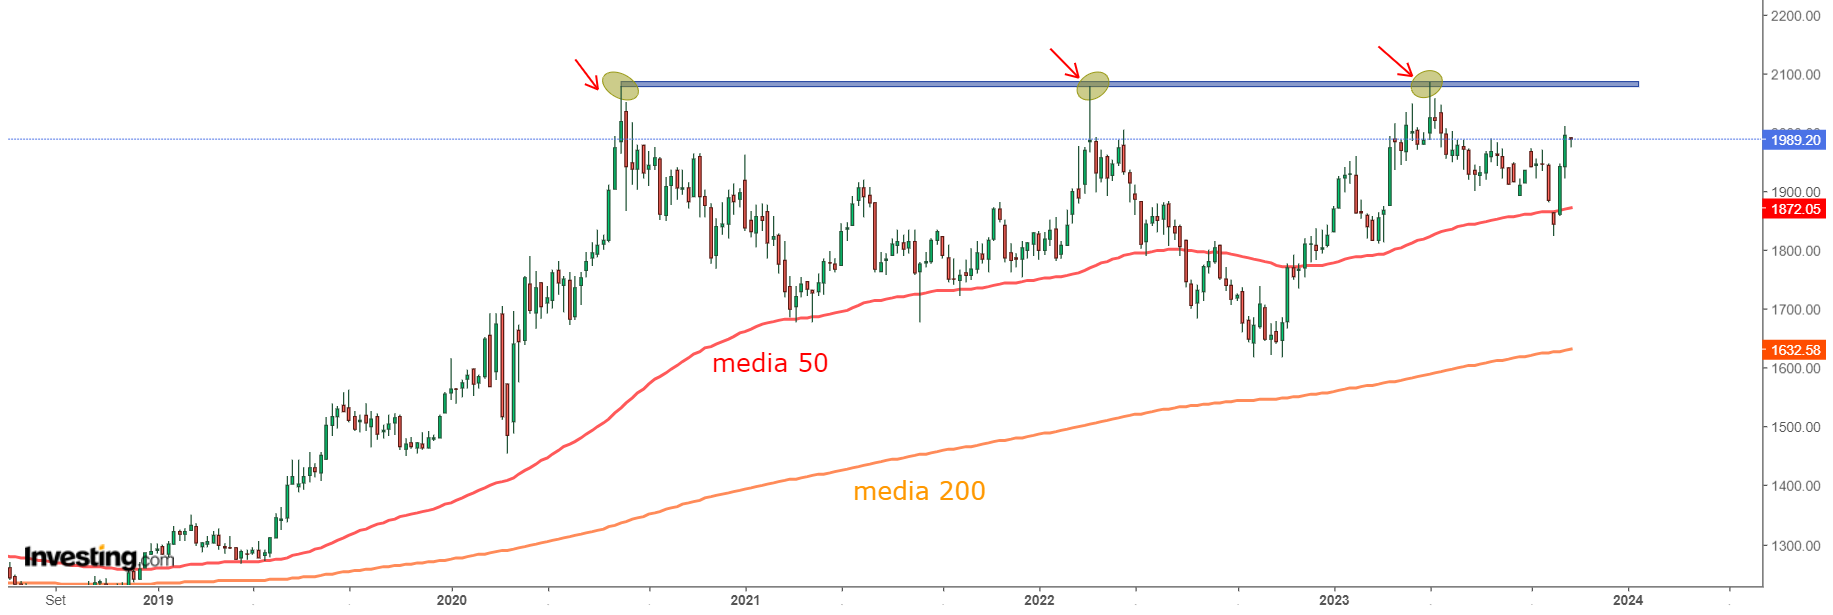
Speaking of commodities, we cannot ignore Gold, which continued last week’s rise, marking its best two-week performance (in more than three years).
It is returning to the same levels as in May, supported by the 50-day average, above $2,000 which is the last hurdle before touching all-time highs (at $2,090).
Many do not believe in the yellow metal, as it has failed three times to break out in the $2090 area starting post-pandemic (August 2020, March 2022, May 2023).
Could the fourth attempt result in the next rally?
***

Find All the Info You Need on InvestingPro!
Disclaimer: This article is written for informational purposes only; it does not constitute a solicitation, offer, advice, or recommendation to invest as such it is not intended to incentivize the purchase of assets in any way. I would like to remind you that any type of asset, is evaluated from multiple points of view and is highly risky and therefore, any investment decision and the associated risk remains with the investor.


