S&P 500: This Pattern With 85% Accuracy Predicts Double-Digit Gains in 2024
2024.07.15 09:02
- The stock market is surging, fueled by a powerful seasonal pattern and falling inflation.
- But a record-breaking trend is raising concerns about a potential future recession.
- Despite the worry, investors remain optimistic, and some small-cap funds are defying the odds.
- Unlock AI-powered Stock Picks for Under $8/Month: Summer Sale Starts Now!
The stock market is currently experiencing a confluence of interesting trends, with one powerful pattern playing out particularly well.
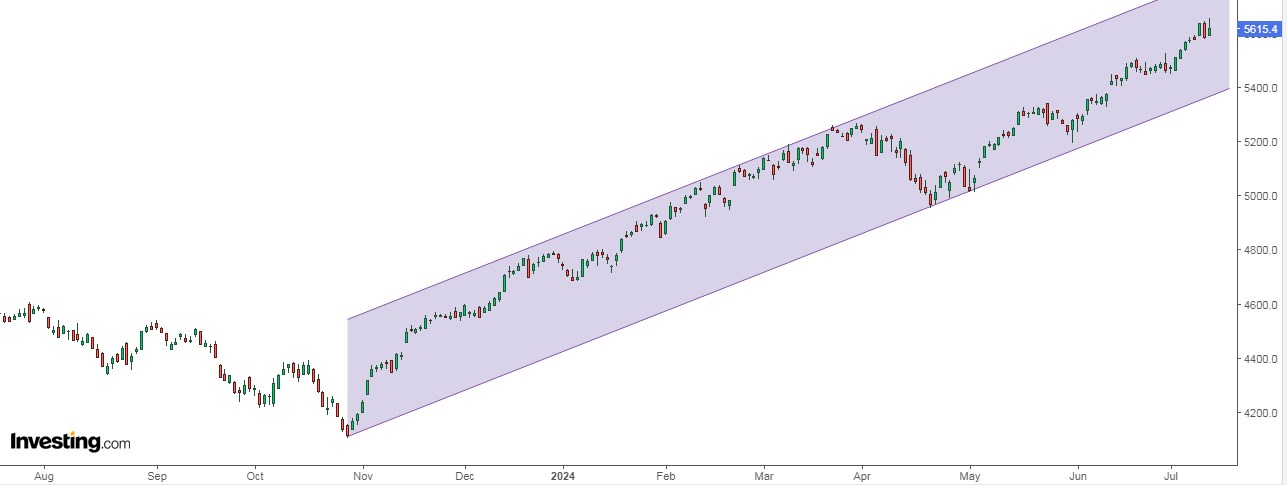
This year, the has enjoyed a strong rally, with the 50 largest companies averaging a 13% gain. This follows a key seasonal indicator: in November and December of last year, the S&P 500 rose more than 10%.

Historically, when this happens, the following year sees the index average double-digit gains – and 2024 is proving no exception. This pattern has held 85% of the time since 1950.
Can Small Caps Catch Up?
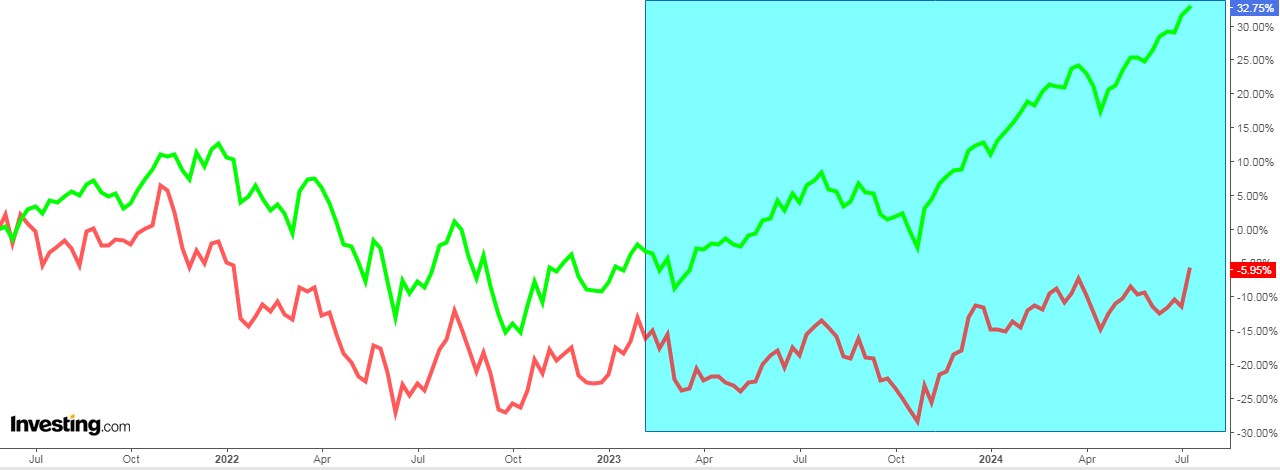
While large-cap stocks are showing strength, small-cap stocks are lagging. This isn’t a new trend – in fact, large caps have outperformed small caps in 7 out of the last 8 years. The , a benchmark for small-cap stocks, significantly trails the ‘s performance in 2024.

However, there are always exceptions. Several small-cap mutual funds are defying the trend and exceeding the S&P 500’s returns this year. (+26% YTD) and (+22.2% YTD) are good examples of such funds.
Longest-Ever Yield Curve Inversion Remains a Concern
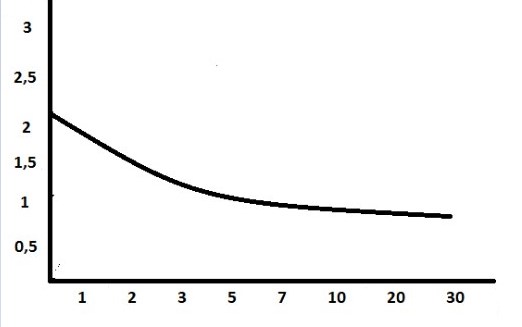
A potential concern lurks beneath the market’s surface: the unprecedented inversion of the U.S. Treasury yield curve. This inversion, which has now persisted for over 500 consecutive days, signifies a historical anomaly. Normally, long-term bonds offer higher yields than short-term bonds. An inverted curve suggests a loss of confidence in the economic future, potentially signaling a recession on the horizon.

However, history offers some solace. In past instances of a flattened yield curve, the S&P 500 has continued to rise, except for 1973. On average, the S&P 500 has even delivered positive returns in the years following a yield curve inversion, with gains of 13.5%, 15%, and 16.4% one, two, and three years later, respectively.
Investor Sentiment Remains Bullish
Despite the inverted yield curve, investor sentiment remains optimistic. The American Association of Individual Investors (AAII) reported bullish sentiment at 49.2%, exceeding the historical average of 37.5%.
Bearish sentiment, on the other hand, sits at 21.7%, below its historical average of 31%.
***
This summer, get exclusive discounts on our subscriptions, including annual plans for less than $8 a month!
Are you tired of watching the big players rake in profits while you’re left on the sidelines?
InvestingPro’s revolutionary AI tool, ProPicks, puts the power of Wall Street’s secret weapon – AI-powered stock selection – at YOUR fingertips!
Don’t miss this limited-time offer.
Subscribe to InvestingPro today and take your investing game to the next level!

Disclaimer: This article is written for informational purposes only; it does not constitute a solicitation, offer, advice, counsel or recommendation to invest as such it is not intended to incentivize the purchase of assets in any way. I would like to remind you that any type of asset, is evaluated from multiple perspectives and is highly risky and therefore, any investment decision and the associated risk remains with the investor.


