S&P 500: Market Breather and Sentiment Results
2023.01.20 12:00
[ad_1]
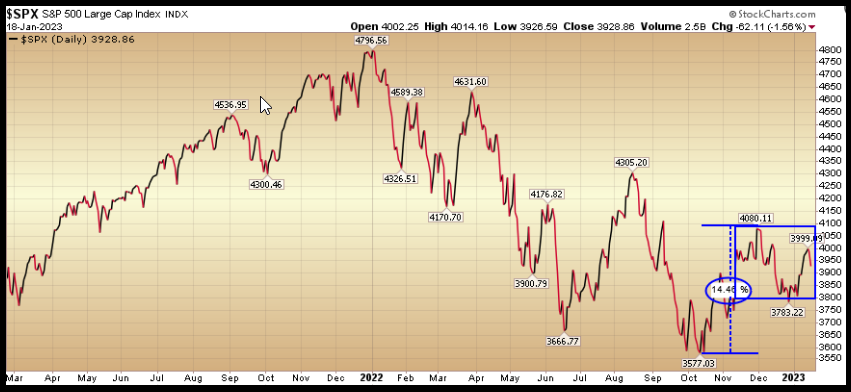
After a 14%+ move off of the October lows, the market has been consolidating sideways for the past 6 weeks or so. This is a normal consolidation and will resolve itself (higher in our view) as we work through earnings and the Fed meeting in coming weeks.
Yesterday I joined Mitch Hoch “Money Mitch” from Benzinga to discuss Earnings, Market Outlook, Fed Policy, Sentiment, Positioning, China, Oil, Tech, Biotech, Picks and more. You will get more from watching this clip than reading the whole article! Thanks to Zoltan Suranyi and Mitch for having me on:
On Thursday evening I joined Phil Yin to discuss US inflation and Chinese investment. Thanks to Phil and Jacqueline Pham for having me on CGTN America:
Earnings
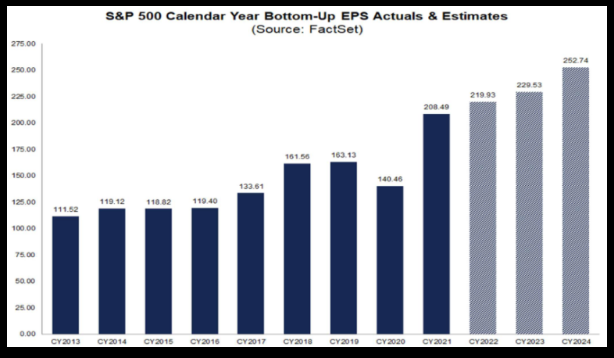
The core tenet of the bearish argument is that the S&P is trading at too high a multiple and the multiple must come down (as earnings will slow):
2
We believe current estimates are too low for 2 reasons:
- China has targeted 5% GDP growth in 2023 and with the backlog of stimulus, easy conditions and pent-up demand being released into a fully opened economy, the odds of an overshoot are high.
- The 10% decline in the should add ~5-8% to S&P earnings that are not yet in the models.
But even EXCLUDING those two positive factors, the path of least resistance is UP. The Market may consolidate a bit in short term to digest a strong move off of the October lows. However, after Q4 earnings season is done in a few weeks, 2022 is DONE. While everyone is hemming and hawing about 17.1x 2023 EPS (3928/229.53), the market will start to discount 2024 EPS of $252.72. That presents a much more desirable picture at 15.5x 2024 EPS (3928/252.74)
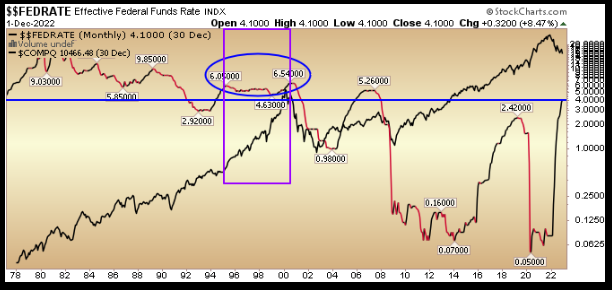
For those who claim 15.5x is still too high because rates have gone up, keep in mind the Fed Funds rate during one of the biggest gaining periods in stock market history (1995-2000) was over 6% (not 4.25-4.50% like now):
3
Also of note is the black line in the background – the . Tech performed very well in a rate environment much more restrictive than present day. While the group may under-perform, there will be quality cash generative tech companies that do very well with the market – despite higher (but historically low) rates.
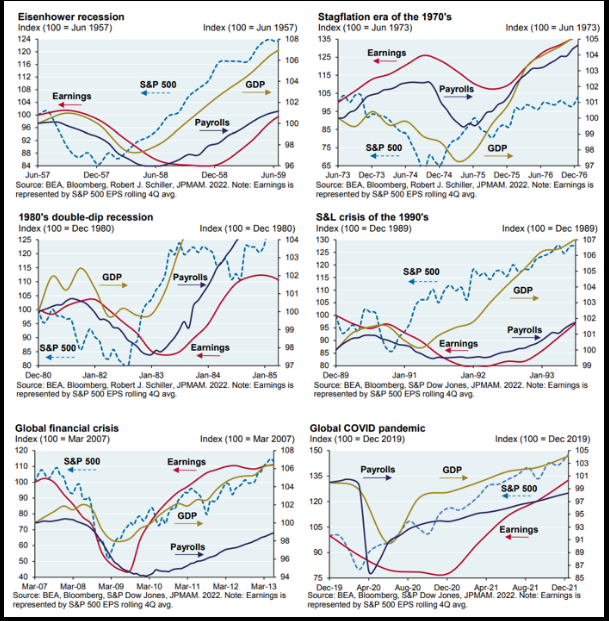
And last but not least, if your bear thesis is that earnings still have to come down, the stock market historically bottoms 6-12 months before earnings bottom (which would point to the October 2022 lows):
4
Sentiment
On Tuesday, Bank of America (NYSE:) published its monthly Global Fund Manager Survey. The survey interviews ~250 managers with ~$750B AUM.
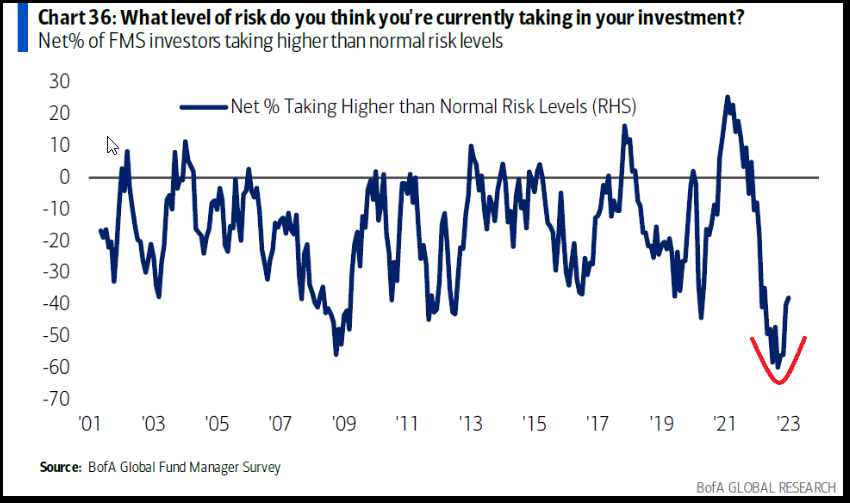
Here were the 5 key takeaways:
Managers have less risk in their portfolio than the bottom of the market in early 2009 GFC:
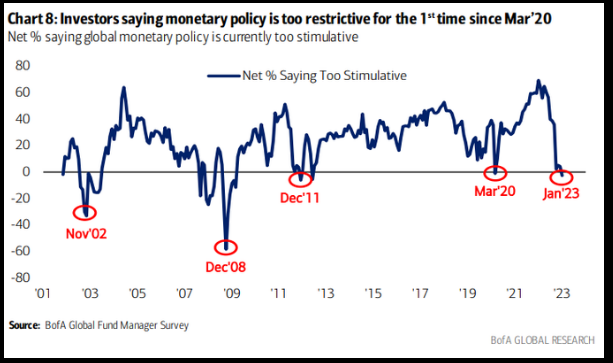
Investors feel fed policy is too restrictive. Historically, you were paid to be a BUYER when this outlook was prevalent (2008 is the exception):
6
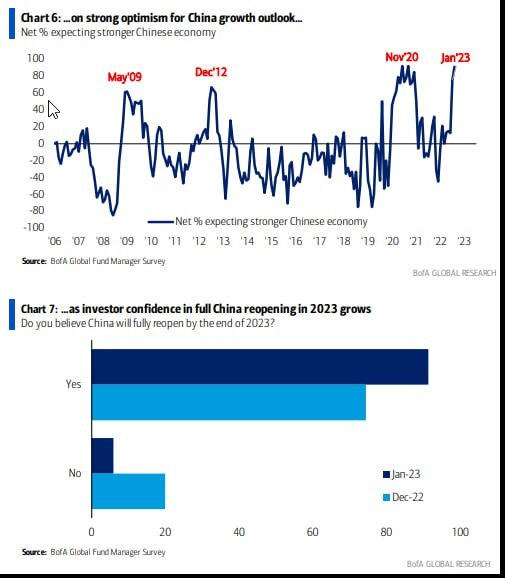
China Growth Outlook is positive. This sentiment is consistent at the early stages of previous rallies in China equities:
7
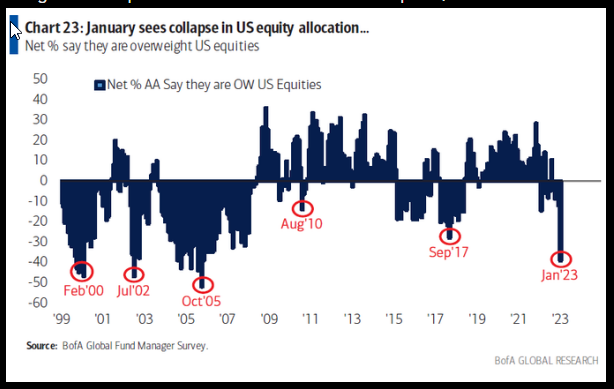
Lowest US Equity Allocation since October 2005. The last 4 instances of managers being this UW equities were times to be a BUYER of equities, not a seller:
8
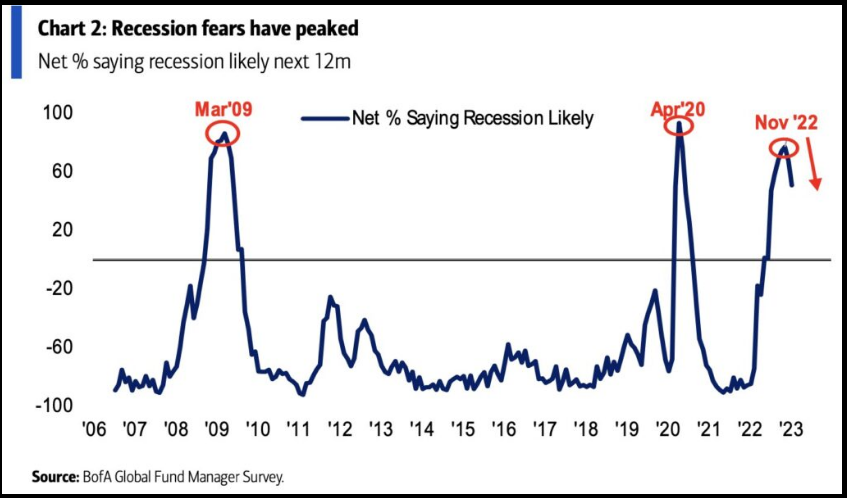
5. Recession Fears peaked in November. That last 2 peaks in fear were at or slightly AFTER major market bottoms:
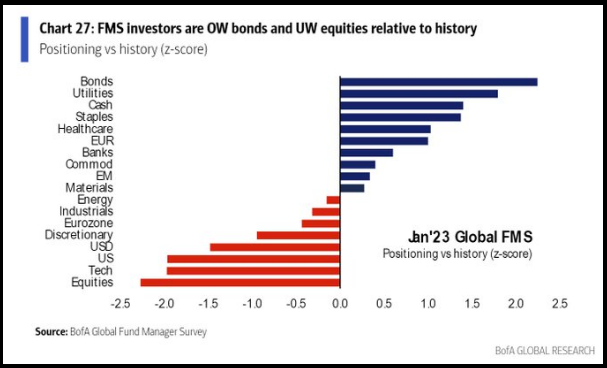
6. Managers are underweight Tech and Equities and Overweight Cash and Bonds:
10
The Fed
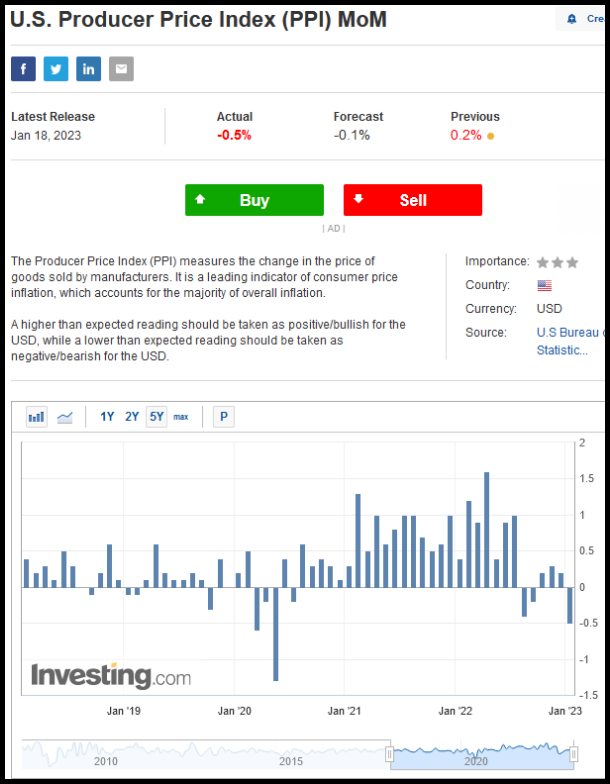
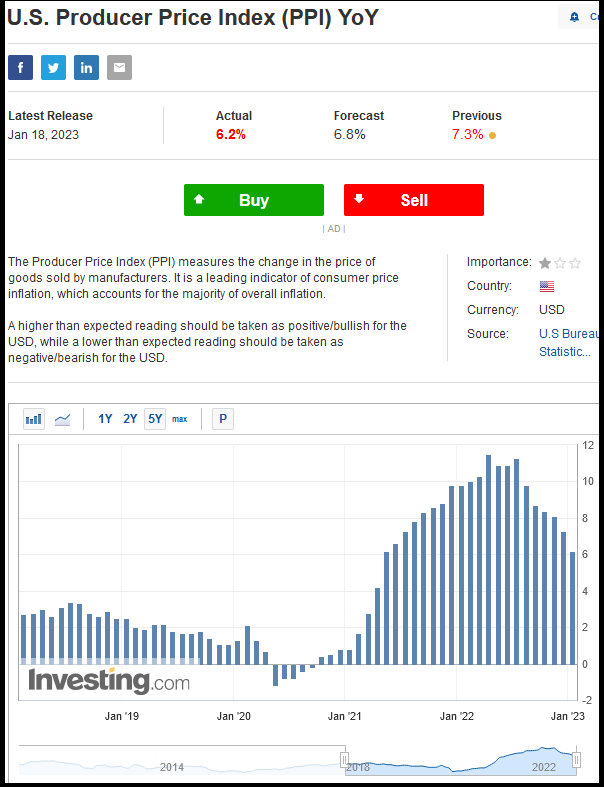
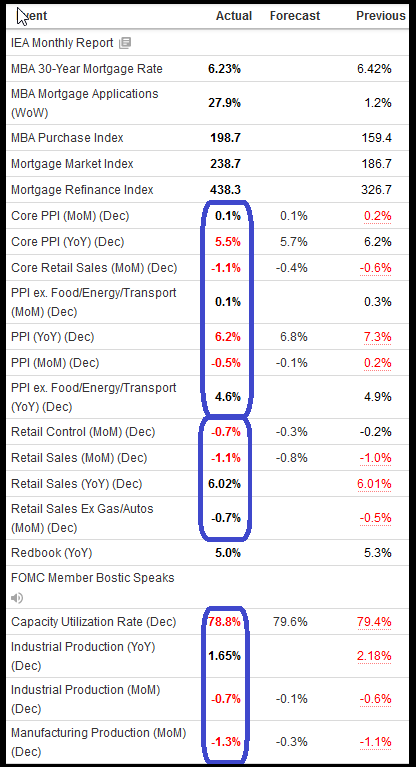
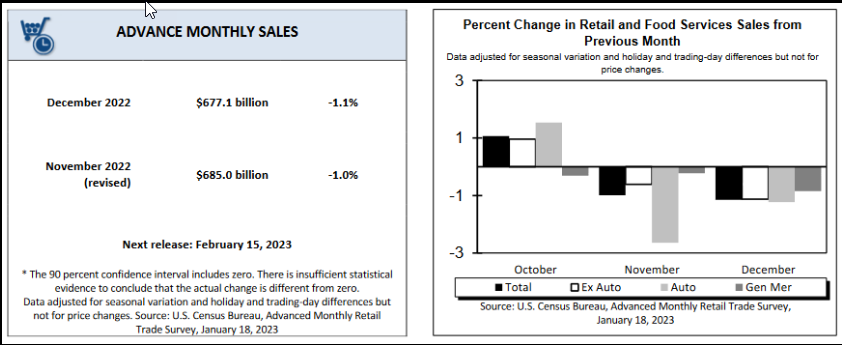
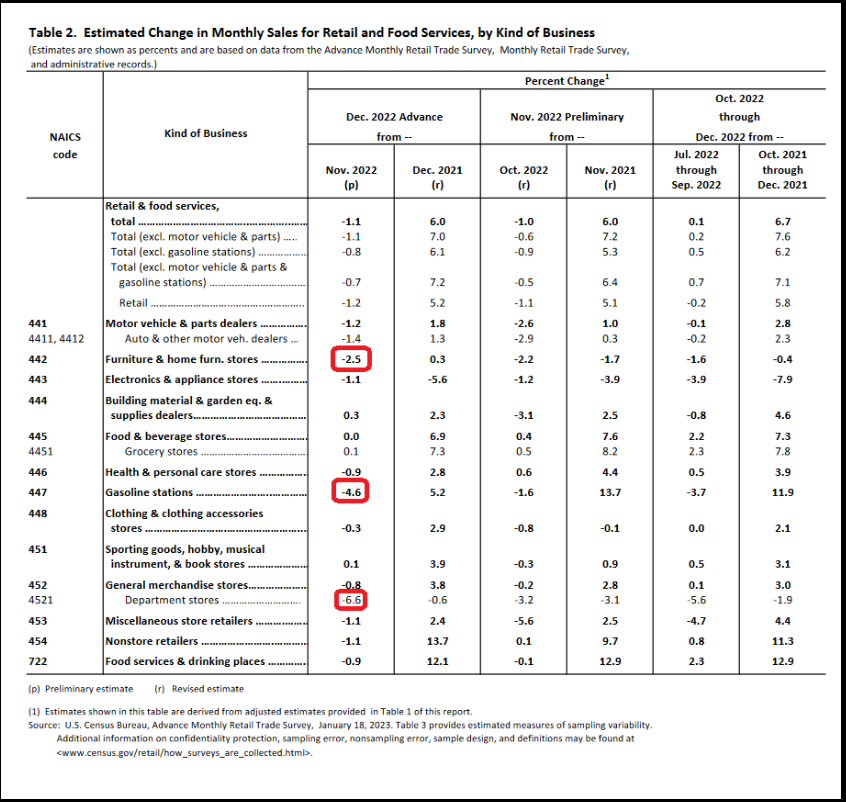
The market initially opened strong on Wednesday off of lower than expected wholesale inflation numbers (PPI) and a weakening economy (Retail Sales). The Fed is accomplishing their mission:
Lowest MoM wholesale inflation since the country was shut down in early 2020:
11
Year on year wholesale inflation collapsing:
12
13
15
Rather than come out and take a victory lap and recognize they (Fed) have come this far (even before the majority of the lag-effect of their policy has kicked in), they instead “doubled down” on the hawk talk. Why make 1 mistake (“transitory”) when you can make 2 (“overshoot”)?
The good news is that the two FOMC members who talked down a rising market into a falling market (to the minute) are no longer voting members – so their words and deeds are meaningless (algos need to be reprogrammed for 2023 VOTING members – versus spectators!):
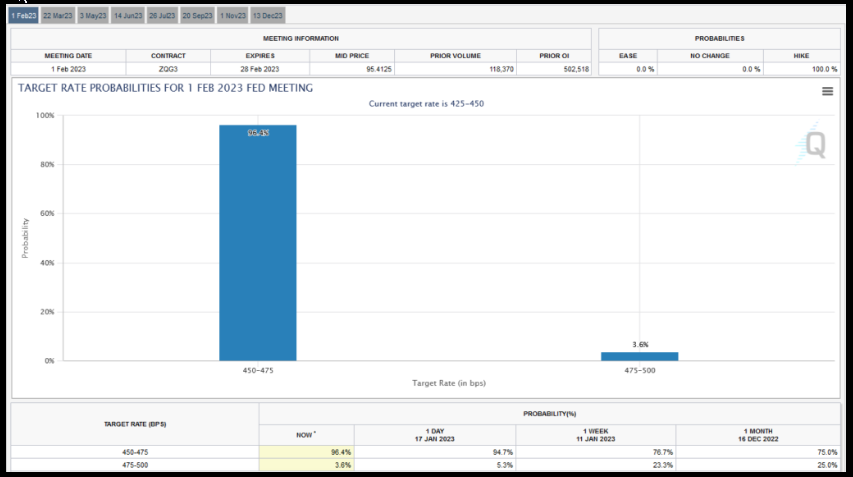
Here’s how the responded to the rhetoric (3.37%):
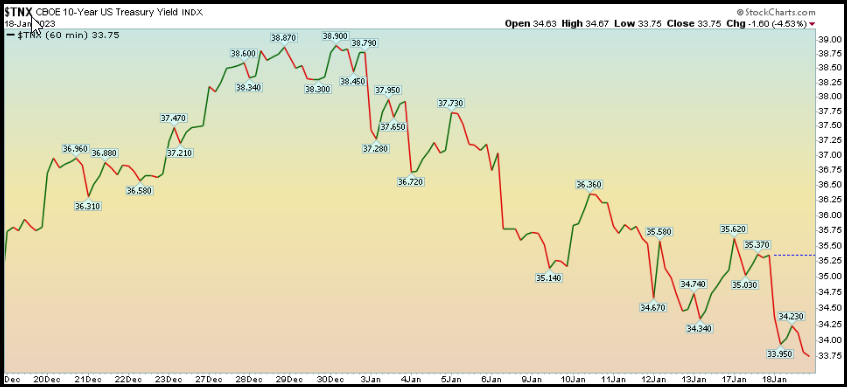
The markets are now pricing a 96.4% probability of a 25bps hike on Feb 1. 50bps is off the table:
Now onto the shorter term view for the General Market:
In this week’s AAII Sentiment Survey result, Bullish Percent (Video Explanation) rose to 31% from 24% the previous week. Bearish Percent dropped to 33.1% from 39.9%. Sentiment is improving for retail traders/investors.
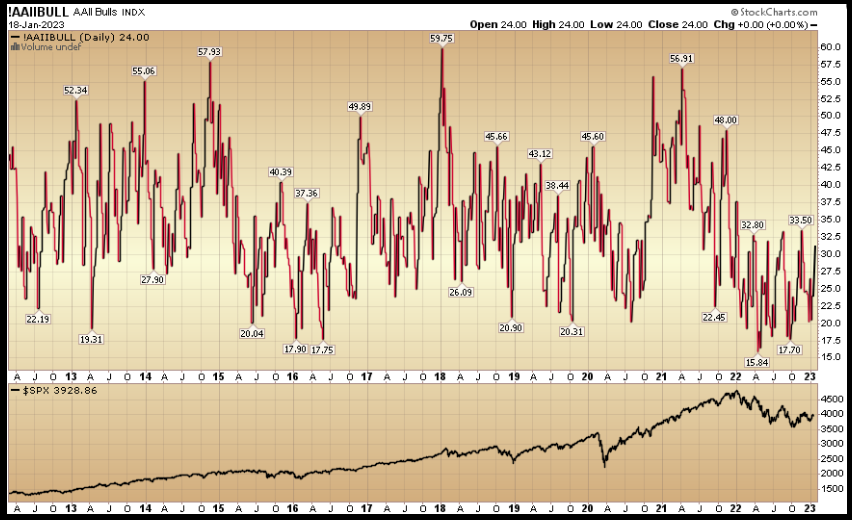
Of note as it relates to the AAII sentiment survey:
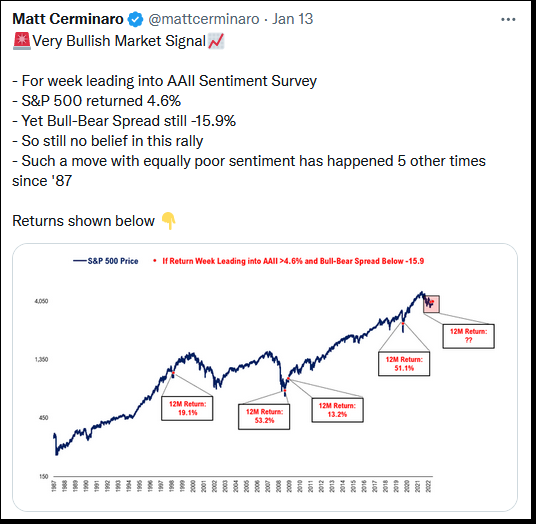
19
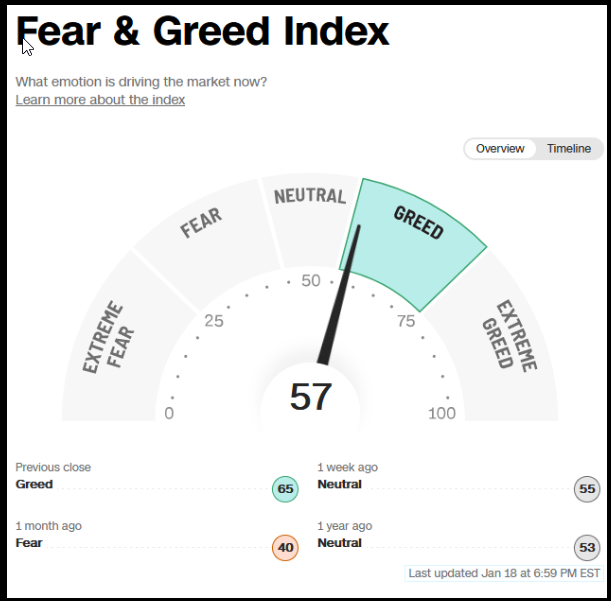
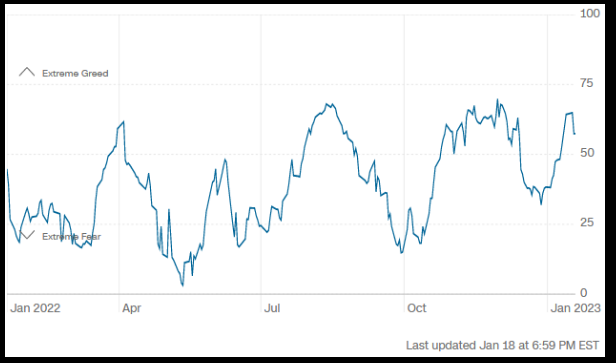
The CNN “Fear and Greed” rose from 54 last week to 57 this week. Sentiment is still neutral. You can learn how this indicator is calculated and how it works here: (Video Explanation)
20
21
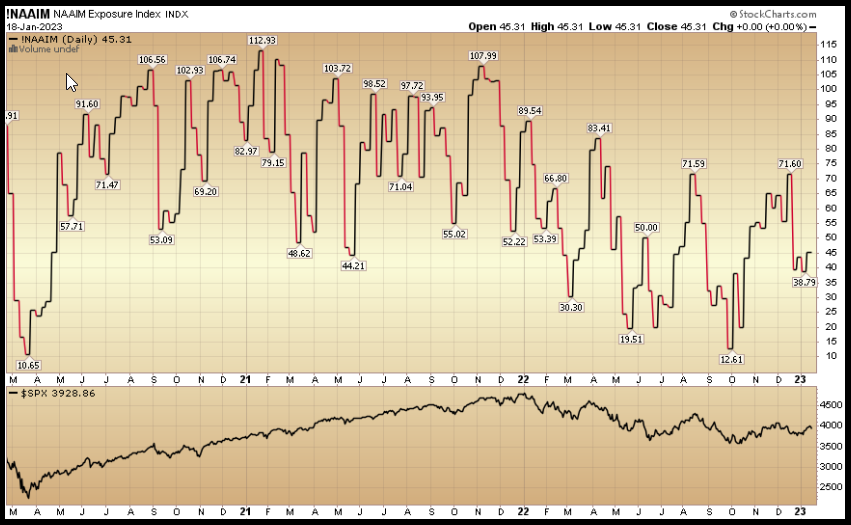
And finally, the NAAIM (National Association of Active Investment Managers Index) (Video Explanation) ticked up to 45.31% this week from 38.79% equity exposure last week.
***
This content was originally published on Hedgefundtips.com
[ad_2]


