Stock Markets Analysis and Opinion

S&P 500: Are You Still Waiting for a Dip That May Never Come?

2024.06.21 07:13

  • Staying invested is key to long-term financial success, but emotions often lead to rash decisions during market uncertainty.
  • Waiting for the perfect entry point can be a costly mistake. Missing market upswings due to fear of dips can significantly hinder your returns.
  • Market corrections are a normal part of the investment cycle, but historical data shows staying invested leads to long-term gains.
  • Invest like the big funds for under $9/month with our AI-powered ProPicks stock selection tool. Learn more here>>

We all know the golden rule of investing: stay invested for long-term financial success. But knowing and doing are two very different things. Especially during periods of market uncertainty, sticking to your investment plan can be incredibly difficult.

The reality is, 90% of the time, emotions can cloud judgment and lead investors to make rash decisions that undermine their long-term goals.
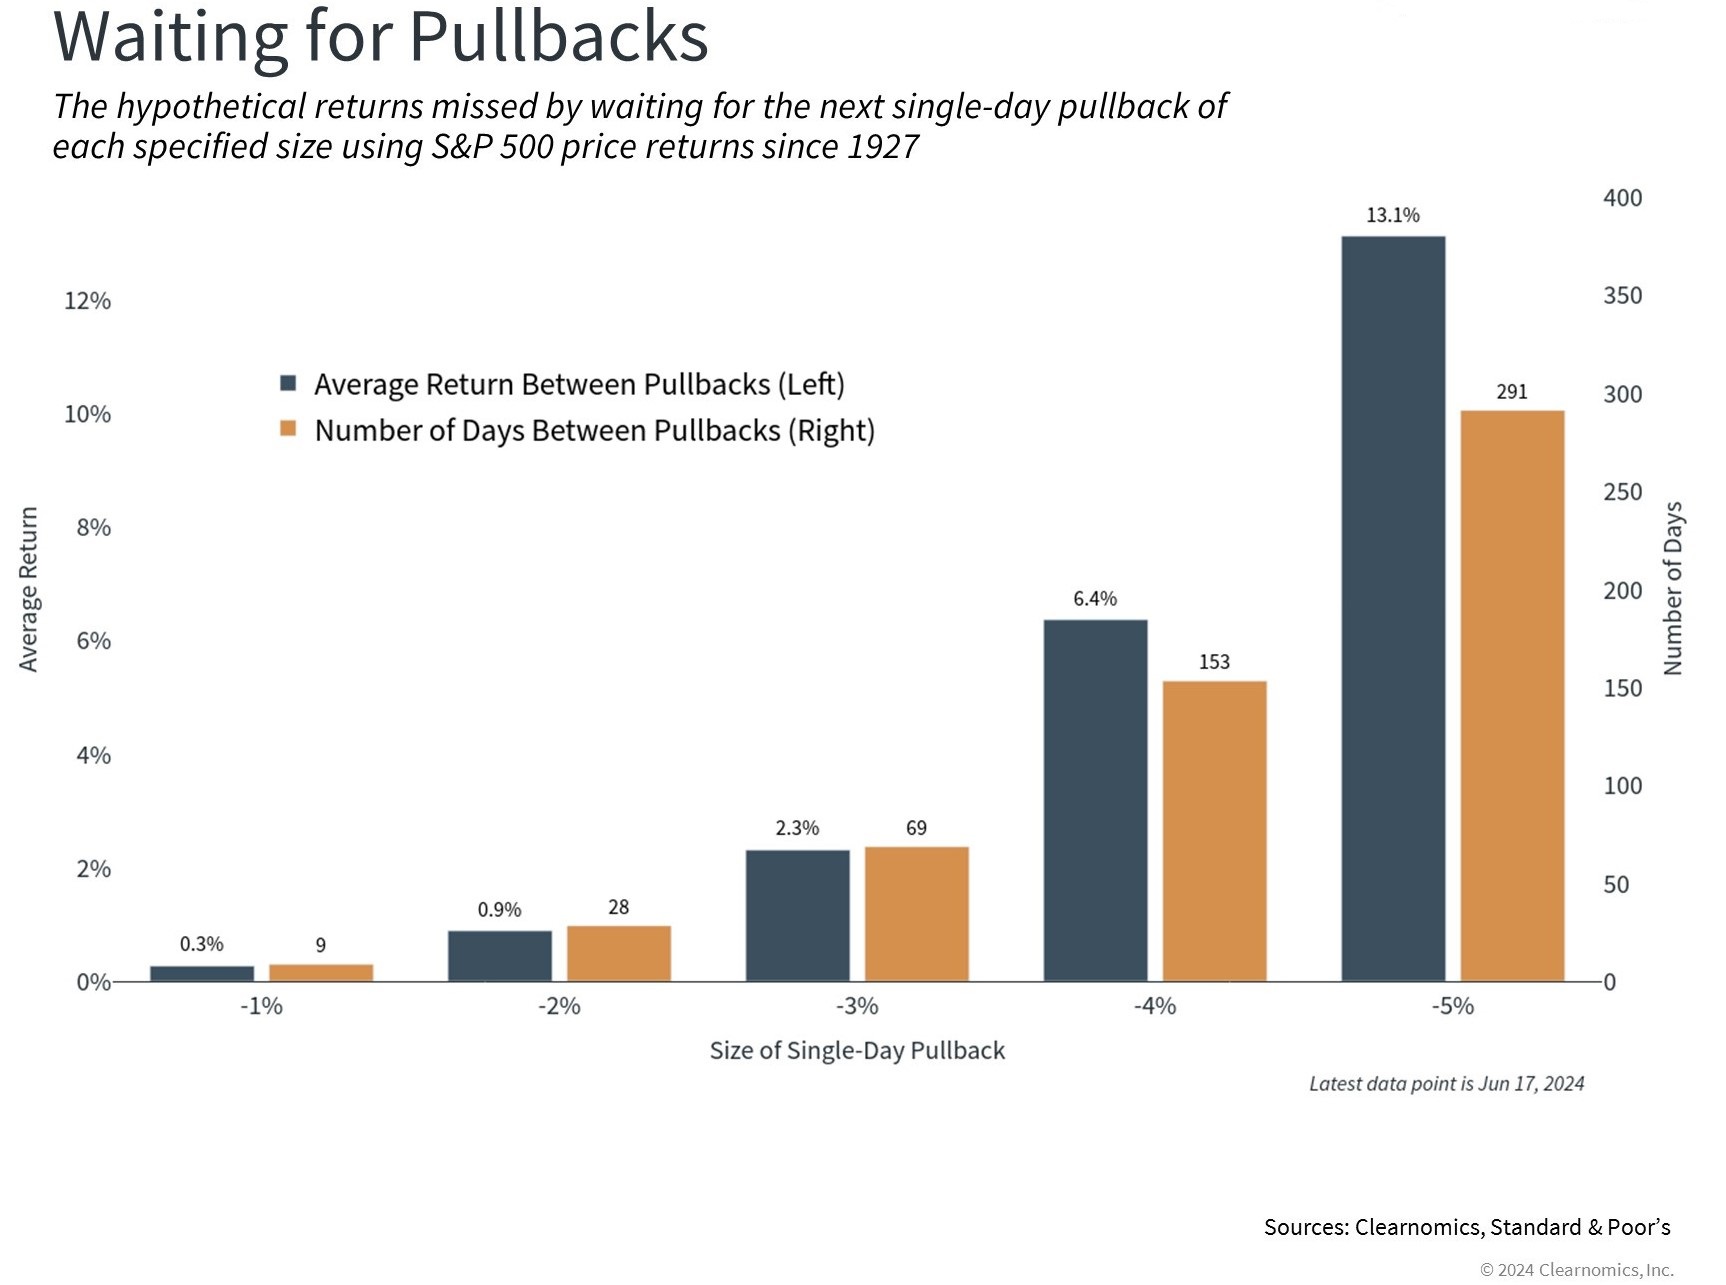
Investors Waiting for Pullbacks

The allure of buying low and selling high is undeniable. However, the chart above reveals a harsh truth: waiting for the perfect entry point often leads to missed opportunities.

Markets tend to rise over time, with unexpected rebounds happening just when you least expect them. Remember the V-shaped recovery in 2020? Sitting on the sidelines during a downturn can leave you out of the upswing.
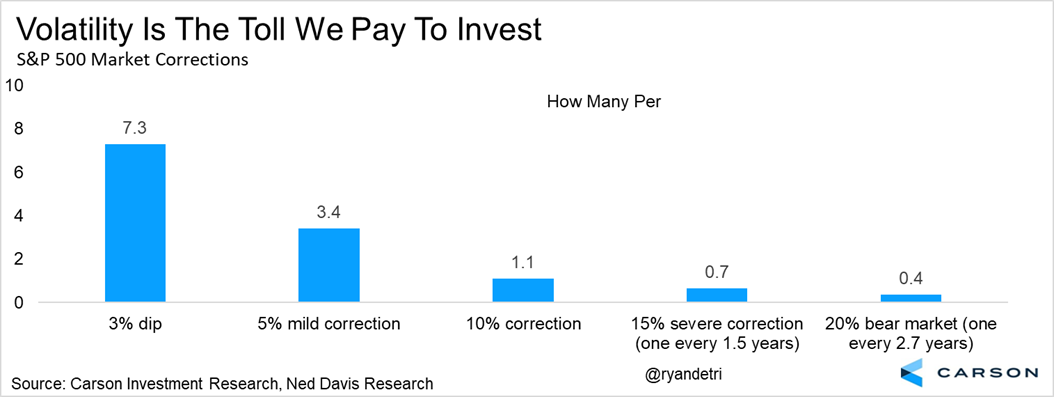
Volatility Levels

Imagine waiting for a 5% drop before investing. Studies show this translates to an average wait time of 291 days! Even though 3-4% pullbacks occur several times a year, the market’s overall upward trend means higher lows are statistically more likely.

The dip you’re waiting for might come after a significant rally you missed out on by waiting for a -5% or -10% drop. Historically, staying invested has paid off. The S&P 500’s annual return (including pullbacks) typically falls between 11% and 13%.

Market Corrections: A Natural Part of the Cycle

Here’s a reality check:

  • The market experiences declines of 3% or more over seven times a year.
  • Stock corrections of 5% happen more than three times annually.
  • On average, expect a 10% correction every year.
  • Every year and a half, there’s a possibility of a correction exceeding 15%.
  • Bear markets (with a 20% drop) occur roughly every three years.

Despite these fluctuations, history shows that staying invested can lead to long-term gains.

Markets Continue to Remain Bullish

While economic conditions might create anxiety, Bank of America (BofA) indicators suggest the market is still trending upwards. This table analyzes sentiment, valuations, and macroeconomics across major market peaks since 1990.
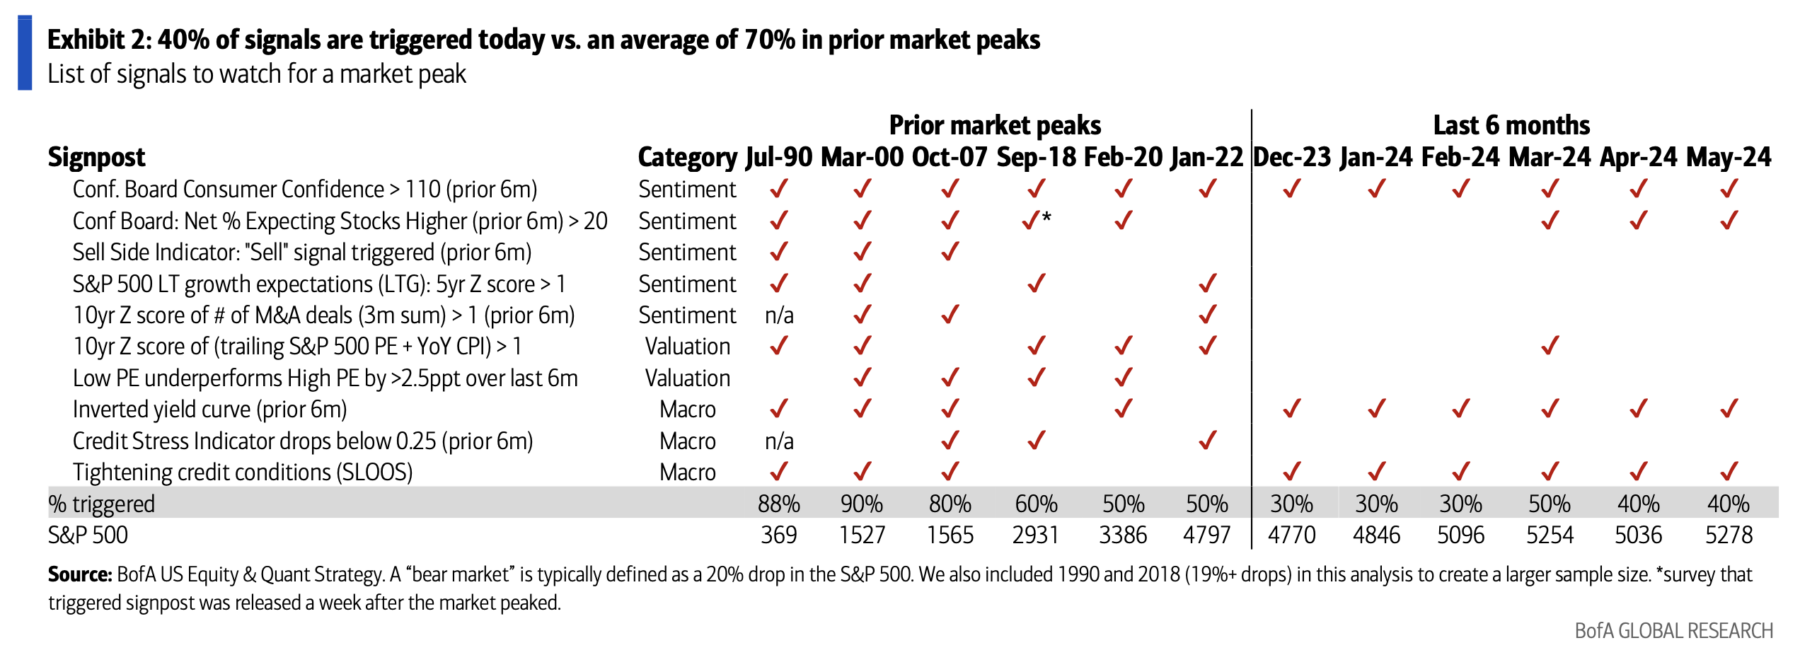
Market Peak Signals

A comprehensive analysis of market sentiment, valuations, and macroeconomic indicators reveals key insights into potential market movements. The table below highlights significant market peaks since 1990, including:

  • July 1990 (1990-91 recession)
  • March 2000 (dotcom bubble)
  • October 2007 (Great Financial Crisis)
  • September 2018 (20 percent decline)
  • February 2020 (COVID-19 pandemic)
  • January 2022 (aggressive monetary policy and rate hikes)

Over these 35 years, indicators have consistently shown a range of 50% to 90% prior to market tops, averaging 70%. Currently, only 40% of these predictive indicators have been triggered, suggesting that an imminent sharp collapse is unlikely.

Instead, the data points to a higher probability of trend continuation, provided there are no significant physiological setbacks.
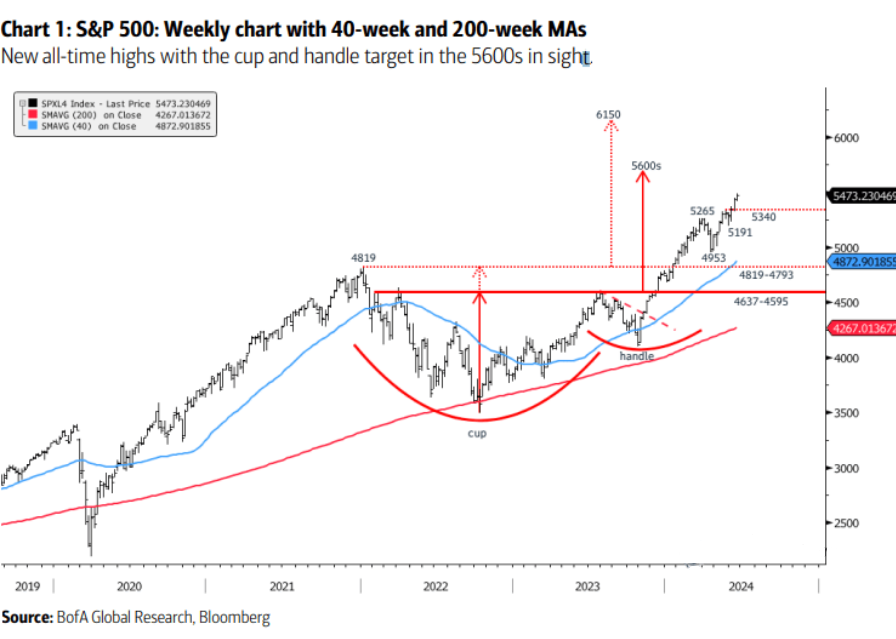
S&P 500 Weekly Chart

BofA’s chart even projects a potential S&P 500 climb to 6150 points, with a bullish cup and handle pattern forming.

The Takeaway: Embrace the Journey

While market volatility is inevitable, the long-term trend favors staying invested. Don’t let the fear of short-term dips prevent you from reaching your financial goals.

***

Become a Pro: Sign up now! CLICK HERE to join the PRO Community with a significant discount.

Subscribe Today!

Disclaimer: This article is written for informational purposes only; it does not constitute a solicitation, offer, advice, counseling or recommendation to invest as such it is not intended to incentivize the purchase of assets in any way. As a reminder, any type of asset is evaluated from multiple points of view and is highly risky therefore, any investment decision and the associated risk remains with the investor. The author owns shares in the company mentioned.


Source link

Related Articles

Stock Markets Analysis and Opinion

S&P 500: Are You Still Waiting for a Dip That May Never Come?

2024.06.21 07:13

  • Staying invested is key to long-term financial success, but emotions often lead to rash decisions during market uncertainty.
  • Waiting for the perfect entry point can be a costly mistake. Missing market upswings due to fear of dips can significantly hinder your returns.
  • Market corrections are a normal part of the investment cycle, but historical data shows staying invested leads to long-term gains.
  • Invest like the big funds for under $9/month with our AI-powered ProPicks stock selection tool. Learn more here>>

We all know the golden rule of investing: stay invested for long-term financial success. But knowing and doing are two very different things. Especially during periods of market uncertainty, sticking to your investment plan can be incredibly difficult.

The reality is, 90% of the time, emotions can cloud judgment and lead investors to make rash decisions that undermine their long-term goals.

Investors Waiting for Pullbacks

The allure of buying low and selling high is undeniable. However, the chart above reveals a harsh truth: waiting for the perfect entry point often leads to missed opportunities.

Markets tend to rise over time, with unexpected rebounds happening just when you least expect them. Remember the V-shaped recovery in 2020? Sitting on the sidelines during a downturn can leave you out of the upswing.

Volatility Levels

Imagine waiting for a 5% drop before investing. Studies show this translates to an average wait time of 291 days! Even though 3-4% pullbacks occur several times a year, the market’s overall upward trend means higher lows are statistically more likely.

The dip you’re waiting for might come after a significant rally you missed out on by waiting for a -5% or -10% drop. Historically, staying invested has paid off. The S&P 500’s annual return (including pullbacks) typically falls between 11% and 13%.

Market Corrections: A Natural Part of the Cycle

Here’s a reality check:

  • The market experiences declines of 3% or more over seven times a year.
  • Stock corrections of 5% happen more than three times annually.
  • On average, expect a 10% correction every year.
  • Every year and a half, there’s a possibility of a correction exceeding 15%.
  • Bear markets (with a 20% drop) occur roughly every three years.

Despite these fluctuations, history shows that staying invested can lead to long-term gains.

Markets Continue to Remain Bullish

While economic conditions might create anxiety, Bank of America (BofA) indicators suggest the market is still trending upwards. This table analyzes sentiment, valuations, and macroeconomics across major market peaks since 1990.

Market Peak Signals

A comprehensive analysis of market sentiment, valuations, and macroeconomic indicators reveals key insights into potential market movements. The table below highlights significant market peaks since 1990, including:

  • July 1990 (1990-91 recession)
  • March 2000 (dotcom bubble)
  • October 2007 (Great Financial Crisis)
  • September 2018 (20 percent decline)
  • February 2020 (COVID-19 pandemic)
  • January 2022 (aggressive monetary policy and rate hikes)

Over these 35 years, indicators have consistently shown a range of 50% to 90% prior to market tops, averaging 70%. Currently, only 40% of these predictive indicators have been triggered, suggesting that an imminent sharp collapse is unlikely.

Instead, the data points to a higher probability of trend continuation, provided there are no significant physiological setbacks.

S&P 500 Weekly Chart

BofA’s chart even projects a potential S&P 500 climb to 6150 points, with a bullish cup and handle pattern forming.

The Takeaway: Embrace the Journey

While market volatility is inevitable, the long-term trend favors staying invested. Don’t let the fear of short-term dips prevent you from reaching your financial goals.

***

Become a Pro: Sign up now! CLICK HERE to join the PRO Community with a significant discount.

Subscribe Today!

Disclaimer: This article is written for informational purposes only; it does not constitute a solicitation, offer, advice, counseling or recommendation to invest as such it is not intended to incentivize the purchase of assets in any way. As a reminder, any type of asset is evaluated from multiple points of view and is highly risky therefore, any investment decision and the associated risk remains with the investor. The author owns shares in the company mentioned.


Source link

Related Articles

Back to top button
bitcoin
Bitcoin (BTC) $ 68,405.33 1.93%
ethereum
Ethereum (ETH) $ 2,642.25 1.41%
tether
Tether (USDT) $ 0.999976 0.02%
bnb
BNB (BNB) $ 599.93 1.68%
solana
Solana (SOL) $ 154.52 2.92%
usd-coin
USDC (USDC) $ 1.00 0.05%
xrp
XRP (XRP) $ 0.545371 0.34%
staked-ether
Lido Staked Ether (STETH) $ 2,641.82 1.47%
dogecoin
Dogecoin (DOGE) $ 0.1376 5.69%
tron
TRON (TRX) $ 0.158991 0.60%
the-open-network
Toncoin (TON) $ 5.22 1.36%
cardano
Cardano (ADA) $ 0.348471 1.56%
avalanche-2
Avalanche (AVAX) $ 27.82 2.27%
wrapped-steth
Wrapped stETH (WSTETH) $ 3,123.77 1.53%
shiba-inu
Shiba Inu (SHIB) $ 0.000019 2.63%
wrapped-bitcoin
Wrapped Bitcoin (WBTC) $ 68,229.28 1.81%
weth
WETH (WETH) $ 2,642.38 1.44%
bitcoin-cash
Bitcoin Cash (BCH) $ 365.75 0.55%
chainlink
Chainlink (LINK) $ 11.39 3.29%
polkadot
Polkadot (DOT) $ 4.26 1.76%
near
NEAR Protocol (NEAR) $ 4.86 2.34%
dai
Dai (DAI) $ 0.999963 0.04%
sui
Sui (SUI) $ 2.10 2.46%
leo-token
LEO Token (LEO) $ 6.09 0.80%
uniswap
Uniswap (UNI) $ 7.39 0.04%
litecoin
Litecoin (LTC) $ 73.23 0.32%
aptos
Aptos (APT) $ 10.00 0.86%
wrapped-eeth
Wrapped eETH (WEETH) $ 2,775.88 1.47%
pepe
Pepe (PEPE) $ 0.00001 5.74%
bittensor
Bittensor (TAO) $ 574.46 1.68%
internet-computer
Internet Computer (ICP) $ 7.99 4.53%
fetch-ai
Artificial Superintelligence Alliance (FET) $ 1.43 5.00%
kaspa
Kaspa (KAS) $ 0.128843 3.21%
monero
Monero (XMR) $ 160.29 2.58%
blockstack
Stacks (STX) $ 1.92 4.20%
ethereum-classic
Ethereum Classic (ETC) $ 19.22 1.04%
stellar
Stellar (XLM) $ 0.096233 1.45%
polygon-ecosystem-token
POL (ex-MATIC) (POL) $ 0.36749 0.70%
first-digital-usd
First Digital USD (FDUSD) $ 0.999299 0.06%
dogwifcoin
dogwifhat (WIF) $ 2.63 2.24%
whitebit
WhiteBIT Coin (WBT) $ 17.68 3.71%
immutable-x
Immutable (IMX) $ 1.54 3.47%
ethena-usde
Ethena USDe (USDE) $ 0.999683 0.06%
okb
OKB (OKB) $ 40.58 0.27%
aave
Aave (AAVE) $ 156.92 2.72%
filecoin
Filecoin (FIL) $ 3.73 1.85%
injective-protocol
Injective (INJ) $ 21.89 2.30%
optimism
Optimism (OP) $ 1.70 1.31%
render-token
Render (RENDER) $ 5.38 3.08%
crypto-com-chain
Cronos (CRO) $ 0.07783 0.22%