S&P 500: A Pattern That Almost Never Fails Is Signaling a Bullish Year Ahead
2024.05.27 06:24
This Memorial Day, investors are looking to history for clues about the market’s future performance. Traditionally, the post-Memorial Day period has seen mixed results.
Before 1996, markets generally performed well during this week. However, since 1996, performance has been weaker, with the averaging a meager 0.05% return.
However, the and still managed positive average returns of 0.31% and 0.88% respectively during this timeframe.
S&P 500’s Bullish Signal
There’s a potentially positive indicator for the rest of the year based on the S&P 500’s recent milestone. The index recently crossed its 100th trading day for 2024.
Historically, when the S&P 500 rises in the first 100 days, it tends to continue its upward trajectory for the remainder of the year.
This pattern has held in 17 out of 20 previous years, with an average gain of 8.8%. Encouragingly, the S&P 500 has climbed 11.3% so far this year, suggesting a potential continuation of the positive trend.
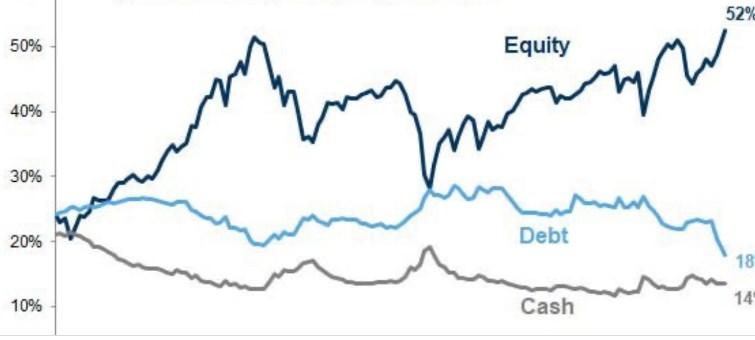
As of now, investors’ allocation to US stocks remains at record highs.

Utilities Sector Surprises, Dividend Payouts Hit Record Highs
The market is also seeing some unexpected developments in specific sectors. Three of the top five gainers in the S&P 500 for 2024 are utilities companies:
- Super Micro Computer (NASDAQ:)
- Vistra Energy Corp (NYSE:)
- Constellation Energy Corp (NASDAQ:)
This surge highlights the dynamic nature of the market and the potential for unexpected growth in certain areas.
On a broader scale, U.S. companies are rewarding investors with record-breaking dividend payouts. In Q1 2024, dividends reached a staggering $164.3 billion, a 7% increase compared to the same period last year.
This trend is mirrored globally, with total dividends hitting a new high of $339.2 billion.
Walgreens Stands Alone with Dividend Cut
While the overall trend in dividends is positive, there’s one notable exception. Walgreens (NASDAQ:) recently decided to slash its quarterly dividend by nearly half.

This move contributed significantly to the stock’s 40% downturn so far in 2024, highlighting the potential consequences of such decisions for a company’s performance.
Investor Sentiment (AAII)
Bullish sentiment, i.e. expectations that stock prices will rise over the next six months, increased 6.2 percentage points to 47% and remains above its historical average of 37.5%.
Bearish sentiment, i.e. expectations that stock prices will fall over the next six months, is at 26.3% and remains below its historical average of 31%.
***
Take the opportunity HERE AND NOW to get the InvestingPro annual plan. Use the code INVESTINGPRO1 and get 40% off your 1-year subscription. With it, you’ll get:
- ProPicks: AI-managed portfolios of stocks with proven performance.
- ProTips: digestible information to simplify a lot of complex financial data into a few words.
- Advanced Stock Finder: Search for the best stocks based on your expectations, taking into account hundreds of financial metrics.
- Historical financial data for thousands of stocks: So that fundamental analysis professionals can delve into all the details themselves.
- And many other services, not to mention those we plan to add soon.

Disclaimer: The author does not own any of these shares. This content, which is prepared for purely educational purposes, cannot be considered as investment advice.


