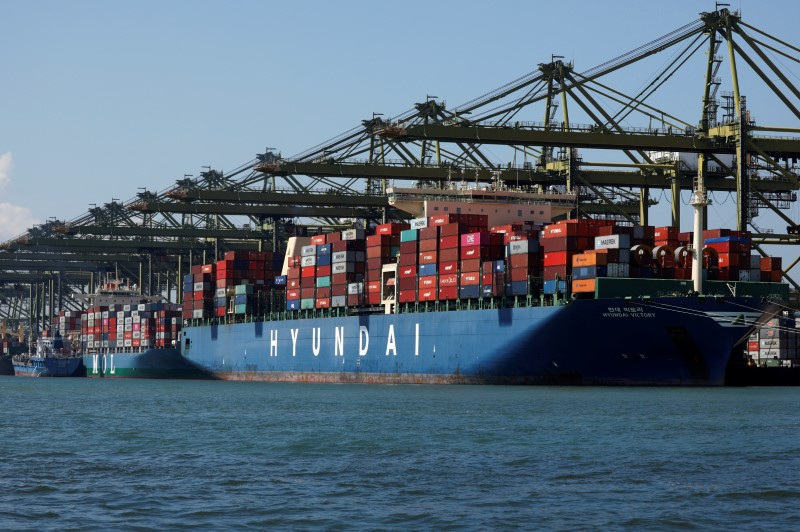
Singapore port congestion shows global ripple impact of Red Sea attacks
2024.06.26 00:20
By Lisa Barrington and Jeslyn Lerh
SEOUL/SINGAPORE (Reuters) -Congestion at Singapore’s container port is at its worst since the COVID-19 pandemic, a sign of how prolonged vessel re-routing to avoid Red Sea attacks has disrupted global ocean shipping – with bottlenecks also appearing in other Asian and European ports.
Retailers, manufacturers and other industries that rely on massive box ships are again battling surging rates, port backups and shortages of empty containers, even as many consumer-oriented firms look to build inventories heading into the peak year-end shopping season.
Global port congestion has reached an 18-month high, with 60% of ships waiting at anchor located in Asia, maritime data firm Linerlytica said this month. Ships with a total capacity of over 2.4 million twenty-foot equivalent container units (TEUs) were waiting at anchorages as of mid-June.
But, unlike during the pandemic, it is not a buying flurry by house-bound consumers that is swamping ports.
Rather, ship timetables are being disrupted with missed sailing schedules and fewer port calls, as vessels take longer routes around Africa to avoid the Red Sea, where Yemen’s Houthi group has been attacking shipping since November.
Ships are therefore offloading larger amounts at once at big transhipment hubs like Singapore, where cargoes are unloaded and reloaded on different ships for the final leg of their journey, and forgoing subsequent voyages to catch up on schedules.
“(Shippers) are trying to manage the situation by dropping the boxes at transhipment hubs,” said Jayendu Krishna, deputy head of Singapore-based consultancy Drewry Maritime Advisors.
“Liners have been accumulating boxes in Singapore and other hubs.”
Average Singapore cargo offload volume jumped 22% between January and May, significantly impacting port productivity, Drewry said.
SEVERE CONGESTION
Singapore, the world’s second-largest container port, has seen particularly severe congestion in recent weeks.
The average wait time to berth a container ship was two to three days, Singapore’s Maritime and Port Authority (MPA) said in end-May, while container trackers Linerlytica and PortCast said delays could last up to a week. Typically, berthing should take less than a day.
Neighbouring ports are also backing up as some ships skip Singapore.
The strain has shifted to Malaysia’s Port Klang and Tanjung Pelepas, said Linerlytica, while wait times have also climbed at Chinese ports, with Shanghai and Qingdao seeing the longest delays.
Drewry expects congestion at major transhipment ports to remain high, but anticipates some easing as carriers add capacity and restore schedules.
Singapore’s MPA said that port operator PSA had re-opened older berths and yards at Keppel (OTC:) Terminal and would open more berths at Tuas Port to tackle extended waits.
Maersk, the world’s second-largest container carrier, said this month it would skip two westbound sailings from China and South Korea in early July due to severe congestion in Asian and Mediterranean ports.
PEAK SEASON
The annual peak shipping season has also arrived earlier than expected, exacerbating port congestion, shippers and research firms said
This seems to be driven by restocking activities, particularly in the U.S., and by customers shipping goods early in anticipation of stronger demand, said Niki Frank, CEO of DHL Global Forwarding Asia Pacific.
Container rates, meanwhile, have surged, raising the risk of another spate of price increases for buyers like the post-pandemic inflation spike which central banks are still trying to tame.
Rates had stabilised into April but in May “there was a significant increase in ocean freight exports of Chinese e-commerce, electric vehicles, and renewable energy-related goods,” Asia-focussed freight forwarder Dimerco said.
“The peak season, which traditionally starts in June, was advanced by a full month, causing ocean freight rates to soar.”
Container import volume at the 10 largest U.S. seaports in May rose 12%, fuelled by the second-highest monthly import volumes since January 2023, said data provider Descartes (NASDAQ:).
“(U.S.) consumers are continuing to spend more than last year, and retailers are stocking up to meet demand,” said Jonathan Gold, a National Retail Federation vice president.
Ocean imports into Europe from Asia are also showing signs of a re-stocking season running into peak season – pushing rates to 2024 highs, Judah Levine of freight platform Freightos said.
Container freight prices from Asia to the U.S. and Europe have tripled since early 2024.
Rates from Asia and Singapore to the U.S. East Coast are at their highest since September 2022, while rates into the U.S. West Coast are highest since August 2022, freight platform Xeneta said.
Some industry players think part of the reason for the bottlenecks at China ports is fuelled by U.S. importers rushing to buy Chinese goods such as steel and medical products that will be subject to steep tariff hikes from Aug. 1.
But newly imposed U.S. tariffs would affect only about 4% of Chinese imports to the U.S., said Jared Bernstein, chair of the Council of Economic Advisers.
Gene Seroka, executive director of the Port of Los Angeles, the largest U.S. gateway for Chinese ocean imports, also expects a limited impact.
“We may see some of this cargo come in, but it is not going to be a deluge,” he said.
Concerns about possible strikes at U.S. ports this year could also be pulling the peak season forward, while DHL said German port strikes were adding to the gridlock.

All of those disruptions will likely mean higher prices for consumers, experts warn.
“These are huge financial hits for shippers to absorb,” said Peter Sand, chief analyst at Xeneta.


