Shaken Wall Street awaits final capitulation to greenlight buying
2022.09.14 18:58
[ad_1]

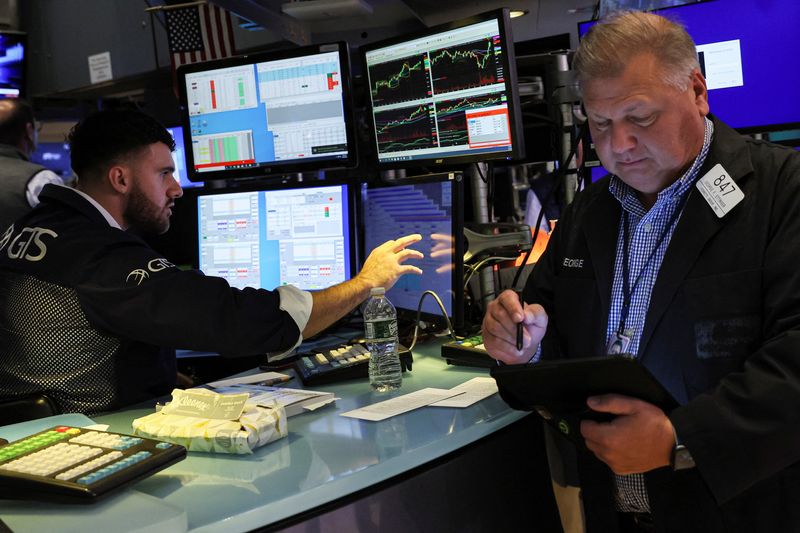
© Reuters. Traders work on the floor of the New York Stock Exchange (NYSE) in New York City, U.S., August 15, 2022. REUTERS/Brendan McDermid
By Alden Bentley
(Reuters) – Even as investors crowded the exits on Tuesday, Wall Street’s steepest one-day shake out since early in the pandemic in June 2020 carried few of the hallmarks of capitulation that analysts want to see before calling a bottom.
While the ‘s 4.3% slump on Tuesday extended fractionally in early trade Wednesday, it held about half a percent above the 3,900 technical area that looks pivotal to buffering a decline to the June bear market low around 3,666.
The benchmark S&P closed Wednesday up about 0.35%. The Nasdaq rose 0.75% after Tuesday’s 5.2% slide — triggered by a surprisingly hot read on August consumer prices that amped up speculation that the Federal Reserve would aggressively tighten rates into next year and tip the economy into recession.
Brian Levitt, chief global strategist at Invesco, said the usual signs that the market has exhausted itself with selling, cleared out weak, long positions, and is ready to find a bottom were not evident.
For instance, the market’s fear guage, the CBOE market volatility index, rose to its highest since July on Tuesday. But it stood at around 26 on Wednesday, remaining below levels above 30 that were seen when the market cratered in June.
Even at that time, as it became clear stocks were in a bear market, the lack of clear signals left analysts sifting through ca
pitulation indicators and coming up short and far from confident to give the ‘all-clear’ to buy again.
High-yield credit spreads have widened out but not by as much as they tend to during times of maximum distress. There was no obvious move from equities into the safety of cash or Treasuries.
“I think investors after what happened during the financial crisis or the early days of Covid, perhaps have a fear of missing out on what could be a relief rally and, quite frankly, we had a nice one in July into the beginning of August,” Levitt said.
He also noted that small investors have not panicked.
“That’s largely because of recent memory, recognizing that they tend to sell at inopportune times. So maybe the investing public is learning their lesson a bit,” he said.
Analysts at Evercore ISI are watching the Sept. 6 S&P 500 “swing low” at 3,886, and consider the , which is hovering near 20-year highs, a global risk barometer.
New dollar highs open up a S&P 500 retest of the June lows, they wrote on Wednesday, “which likely produces the ‘desired capitulation’ trade of a >40, absent throughout 2022. Our base case remains elevated volatility with an eventual 4Q rally toward our year end PT of 4,200.”
Meanwhile, the breadth of the decline makes it look like the market will be able to hold its lows from June, according to Sam Stovall, who noted that all of the sub-industry indexes in the broader S&P 1500 traded above their 50-day moving average on Tuesday and only 7% were above their 200-day moving average. “Any time since 1995 that we had such a washout of breadth, that signaled a bottom for a bear market or a correction,” said Stovall. As for the S&P 500, Stovall noted the benchmark index had already recovered 50% of its January-June 2022 bear market move on August 12, and that the index has never in history marked a new low after recovering 50% of what it had previously lost.
Art Hogan, chief market strategist at B. Riley Wealth, said in his daily client note that it was important to put the painfull sell-off in context.
“Coming into the day, the S&P 500 had four consecutive positive days, gaining 5.5%. Tuesday’s precipitous drop brings the large cap index back to where it was last Wednesday,” wrote Hogan. “The S&P 500 is still 7.2% above the June lows. The important support level of 3,900 held yesterday, another constructive data point.”
[ad_2]
Source link


