Rates, Inflation, Oil, War: Could a 1987-Style Crash Be in the Cards?
2023.10.23 05:48
- The current macro, geopolitical scenario is eerily similar to that of 1987
- That year, the stock market crashed following a substantial rise
- So, could we witness a 1987-like crash, considering the parallels between then and now?
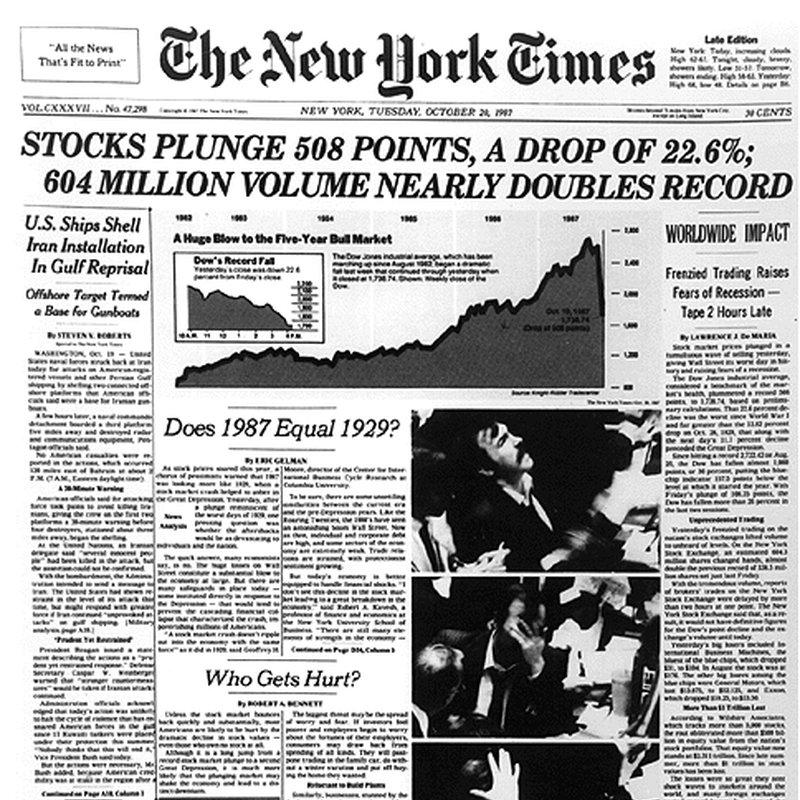
Thursday, October 19, marked the 36th anniversary of the infamous 1987 crash, a day etched into the annals of financial history as Black Monday.
From August 1982 to August 1987, the 19 largest global markets collectively saw an astonishing average return of +296%.
During this period, the skyrocketed from 776 to 2,722 points, including a remarkable 44% surge in the first eight months of 1987 alone. This eerily prescient statement was uttered by economist John Kenneth Galbraith in an article in The Atlantic back in January 1987:
“It will be a day of reckoning when the market descends as if it were never going to stop.”
Little did he know that his words would soon be realized.
The Dow Jones experienced its most substantial single-day plunge in history – a grim record that endures to this day – as ut tumbled by an astonishing -22.6%, or 508 points, surpassing the prior record of a -20.5% drop at the conclusion of 1914 when the market had been shuttered for several months due to World War I.

Here are the 8 biggest one-day drops in the history of the Dow Jones:
- October 19, 1987: -22.6%.
- December 14, 1914: -20.5%.
- October 28, 1929: -13.5%.
- March 16, 2020: -12.9%.
- December 18, 1899: -12% December 18, 1899: -12
- 29 de octubre de 1929: -11,7%
- October 5, 1931: -10.7% March 12, 2020
- March 12, 2020: -10%.
Even before Black Monday, in the three previous sessions, the market had already fallen by -3.8%, -2.4%, and -4.6%, respectively, foreshadowing what was to come.
The disaster spared no one. Warren Buffett lost $347 million, Bill Gates lost $255 million, and the family of Sam Walton, the founder of Walmart (NYSE:), lost $1.75 billion.
Outside of Wall Street, there was also bloodshed, with the Canadian stock market down -22.5%, the down -20.5%, the Japanese down -14.9%, and the British down -12.2%.
Are We in for a Repeat of History?
In 1987, the economic and geopolitical backdrop was notably unfavorable. It included a substantial trade deficit, interest rate hikes driven by high inflation, the Iran-Iraq war, speculations about US involvement in Iran, challenges with supply, and even issues in the real estate market.
It’s worth noting that some investors are expressing concerns about parallels between the conditions of Black Monday in 1987 and the current situation.
These concerns include the S&P 500’s significant gains for the year, a third-quarter market decline, rising interest rates, elevated inflation, a strong , and ongoing geopolitical conflicts, such as Russia’s conflict with Ukraine and the Hamas-Israel conflict, which have heightened worries about the oil market.

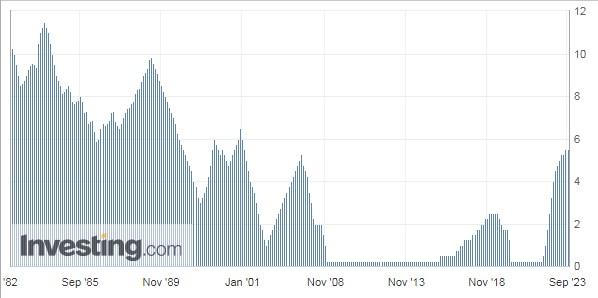
US Interest Rates
However, it’s important to note that several significant differences exist from the situation in 1987. The S&P 500 was considerably more overbought in 1987 compared to now.
Additionally, interest rates, while on the rise, were at higher levels during that period (early 1987 started with rates at 5.75%, and the Federal Reserve gradually increased them throughout the year).
These distinctions suggest that the current market conditions are much better compared to the situation back then and markets may not face a similar fate as in 1987.
Index Returns Rankings Year-to-Date
- : +24,05%
- Nikkei: +19.79%.
- : +15.40%
- S&P 500 +10,02%
- : +9.72%
- : +6,28%
- : +6,09%
- : +5,29%
- Dow Jones: -0,06%
Investor sentiment (AAII)
Bullish sentiment, i.e. expectations that stock prices will rise over the next six months, increased 9.9 percentage points to 40%. Optimism was last highest on September 7, 2023 (42.2%).
Bearish sentiment, i.e., expectations that stock prices will fall in the next six months, fell 5.1 percentage points to 36.5%. Pessimism remains above its historical average of 31%.
***

Amazon Earnings: What to Expect?
Disclaimer: This article is written for informational purposes only; it does not constitute a solicitation, offer, advice, or recommendation to invest as such it is not intended to incentivize the purchase of assets in any way. I would like to remind you that any type of asset, is evaluated from multiple points of view and is highly risky and therefore, any investment decision and the associated risk remains with the investor.


