Nvidia Resumes Uptrend, But Can It Reclaim ATH Ahead of Earnings?
2024.08.20 08:11
- Nvidia stock has bounced back from a sharp decline with eyes on new highs.
- The chipmaker’s sharp rebound has lifted the broader markets too.
- But amid increasing competition and overvaluation concerns, can the stock scale all-time highs?
Nvidia (NASDAQ:) shares experienced a dramatic plunge last month, but a subsequent rebound has seen the stock recover much of its losses.
While the recent recovery is encouraging, investors remain cautious. Despite the stock’s impressive performance over the past year, concerns about overvaluation and increasing competition in the artificial intelligence space have persisted.
Recent 13-F filings reveal that some institutional investors have reduced their holdings, potentially contributing to the initial selloff.
However, other investors have increased their positions and bought the recent dip, indicating continued confidence in the company’s long-term prospects.
While the stock has shown resilience, overcoming the $130 level will be crucial for sustaining the upward momentum and opening doors to test the all-time high levels once again.
Chipmaker Faces Increasing Competition
AMD (NASDAQ:), the second-largest player in the tech industry, continues to strengthen its position in artificial intelligence with strategic acquisitions.
Recently, AMD announced a $5 billion acquisition of ZT Systems, a server development company, following its purchase of Silo AI last month. These moves signal AMD’s intent to compete more closely with Nvidia.
Meanwhile, Nvidia faces its own challenges. The company recently announced a delay in the release of the Blackwell GPU, now expected to launch in the first quarter of 2025.
This delay, along with postponed plans for new AI data centers, has raised concerns among investors.
Adding to Nvidia’s hurdles, the U.S. government previously restricted the company from selling H100 chips to Chinese consumers on security grounds.
In response, China-based Huawei plans to launch a new AI chip in October that could rival Nvidia’s offerings in the Chinese market, opening a new front in the AI sector.
Despite these challenges, Nvidia remains a dominant force in artificial intelligence, supported by strong cash flow and financials. The company shows no signs of slowing down and continues to invest aggressively, keeping pressure on its competitors.
Next week’s earnings report will be crucial. Investors will closely watch whether Nvidia exceeds growth expectations, maintains market share, and manages margins.
Additionally, the company’s official statements regarding the Blackwell chipset delay could significantly influence investor sentiment.
Nvidia: Rebound Underway, but Challenges Remain
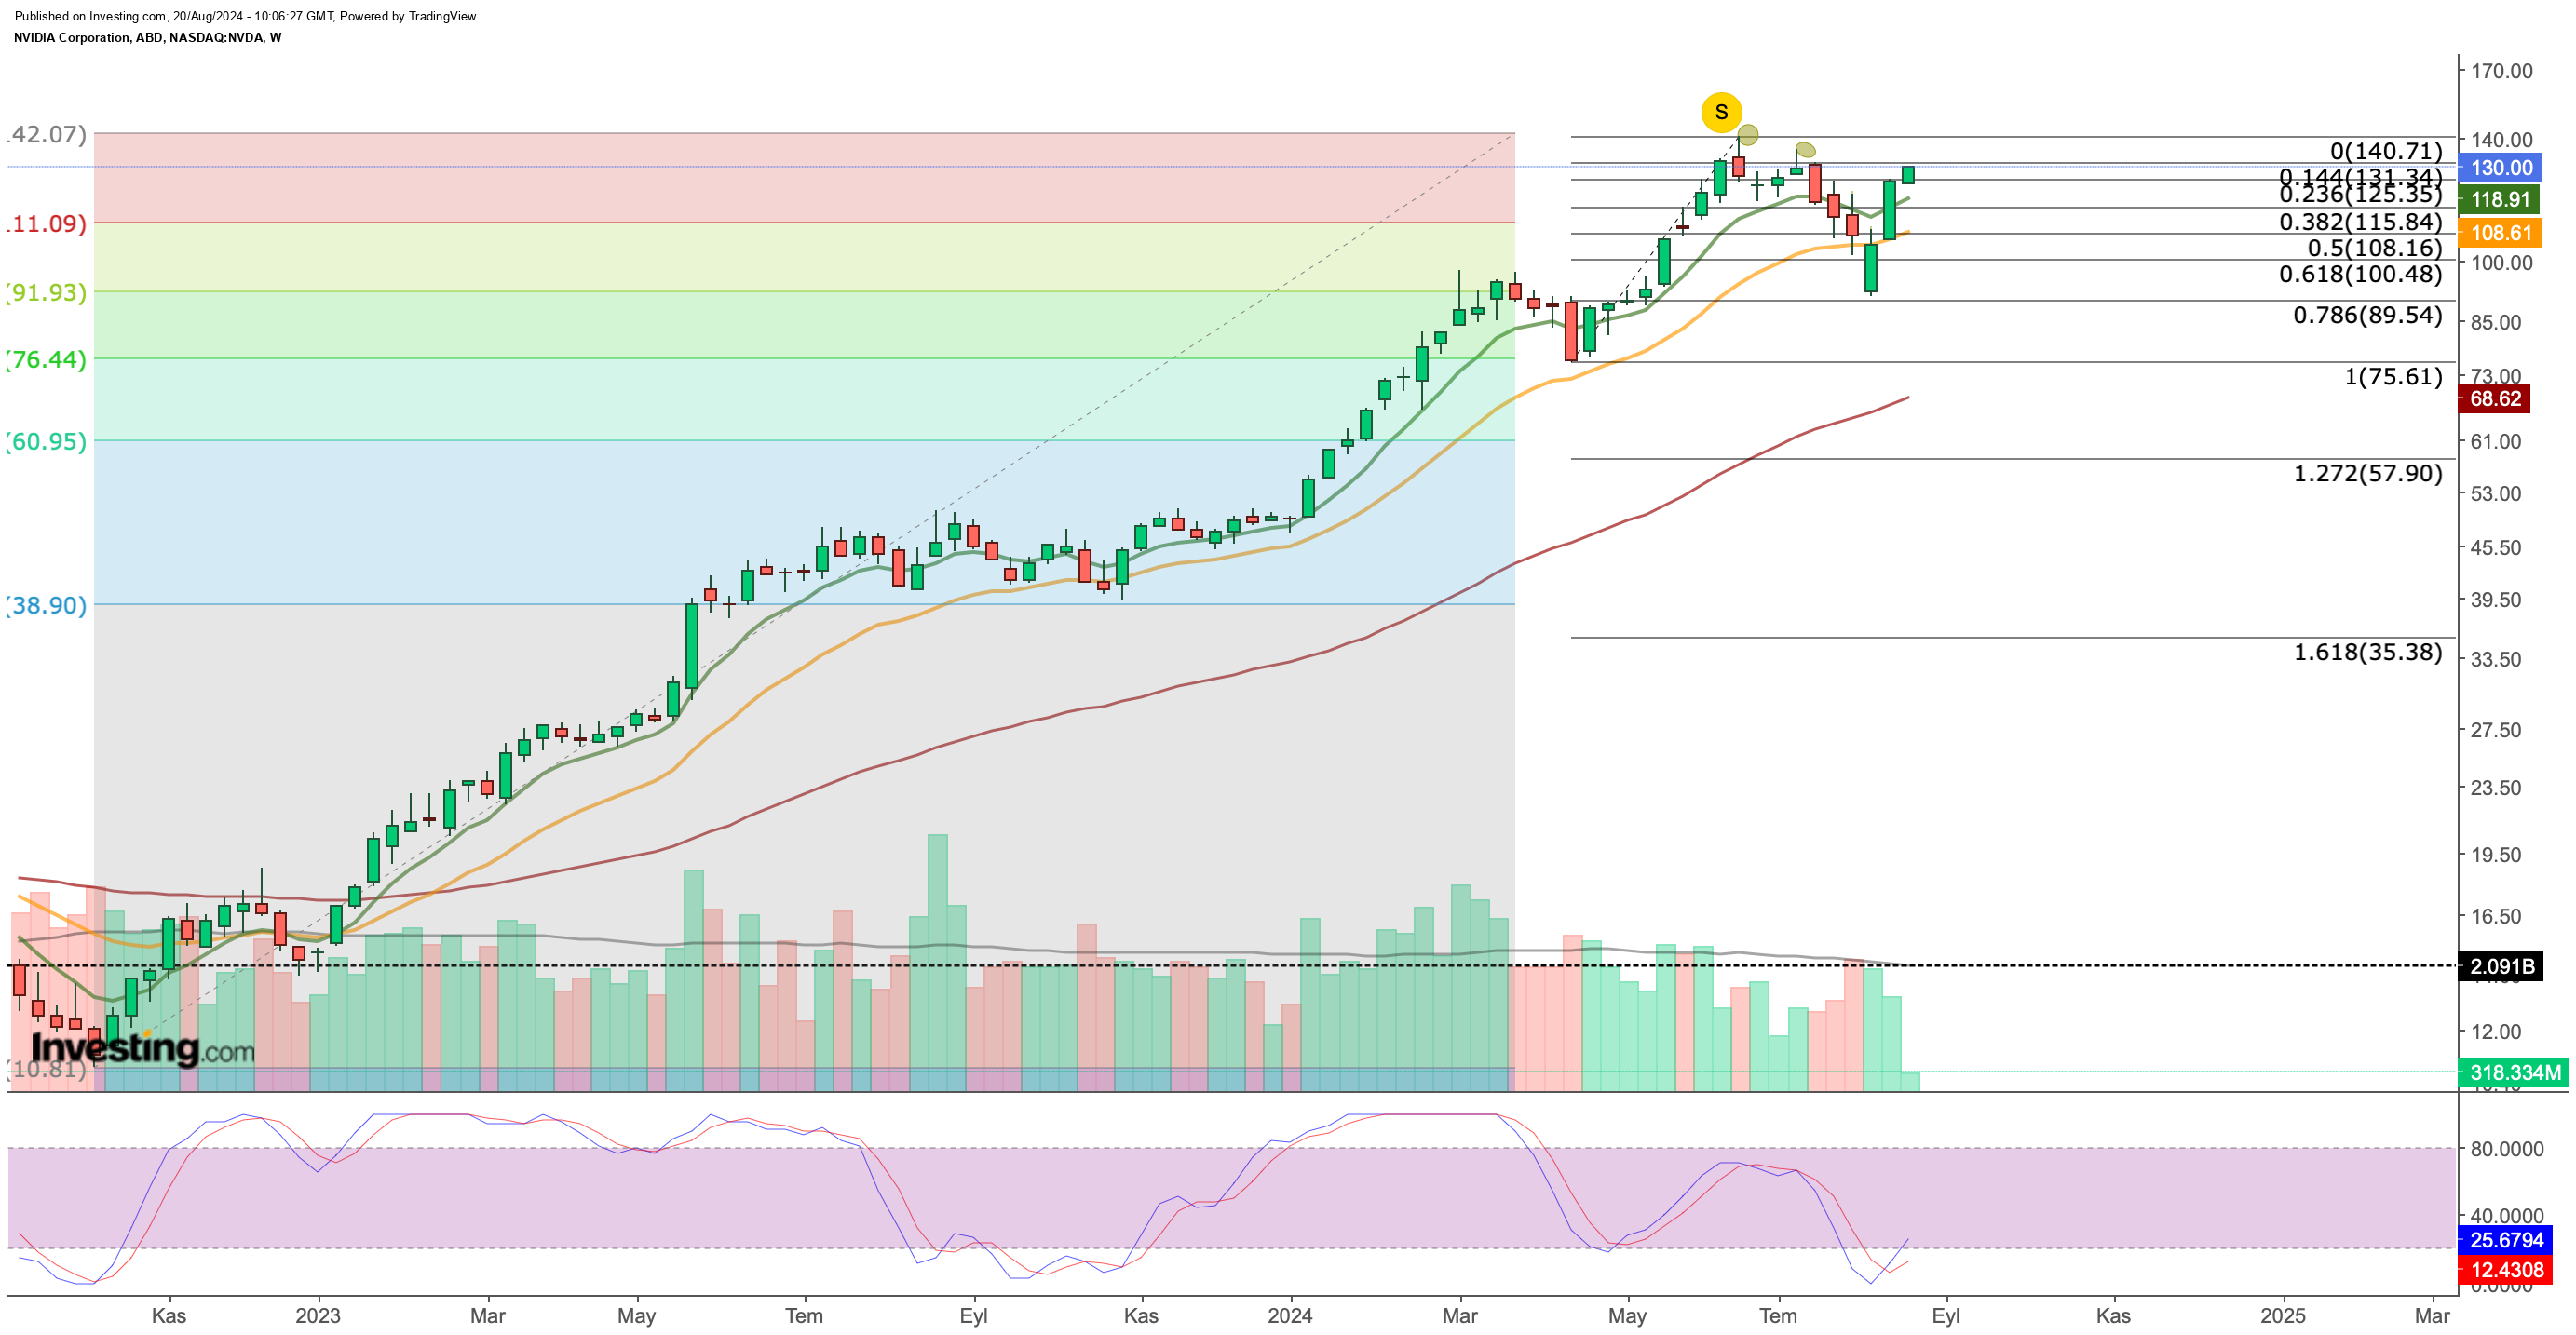
Nvidia stock staged a strong recovery after a sharp correction in July, finding support at the $90 level. Technical indicators, such as the Stochastic RSI, suggest a potential continuation of the upward trend.
The stock has reclaimed its short-term moving averages and is currently testing the $130 resistance level. A decisive break above this point could open the door to a rally towards the $140 – $170 range, based on Fibonacci extension levels. 
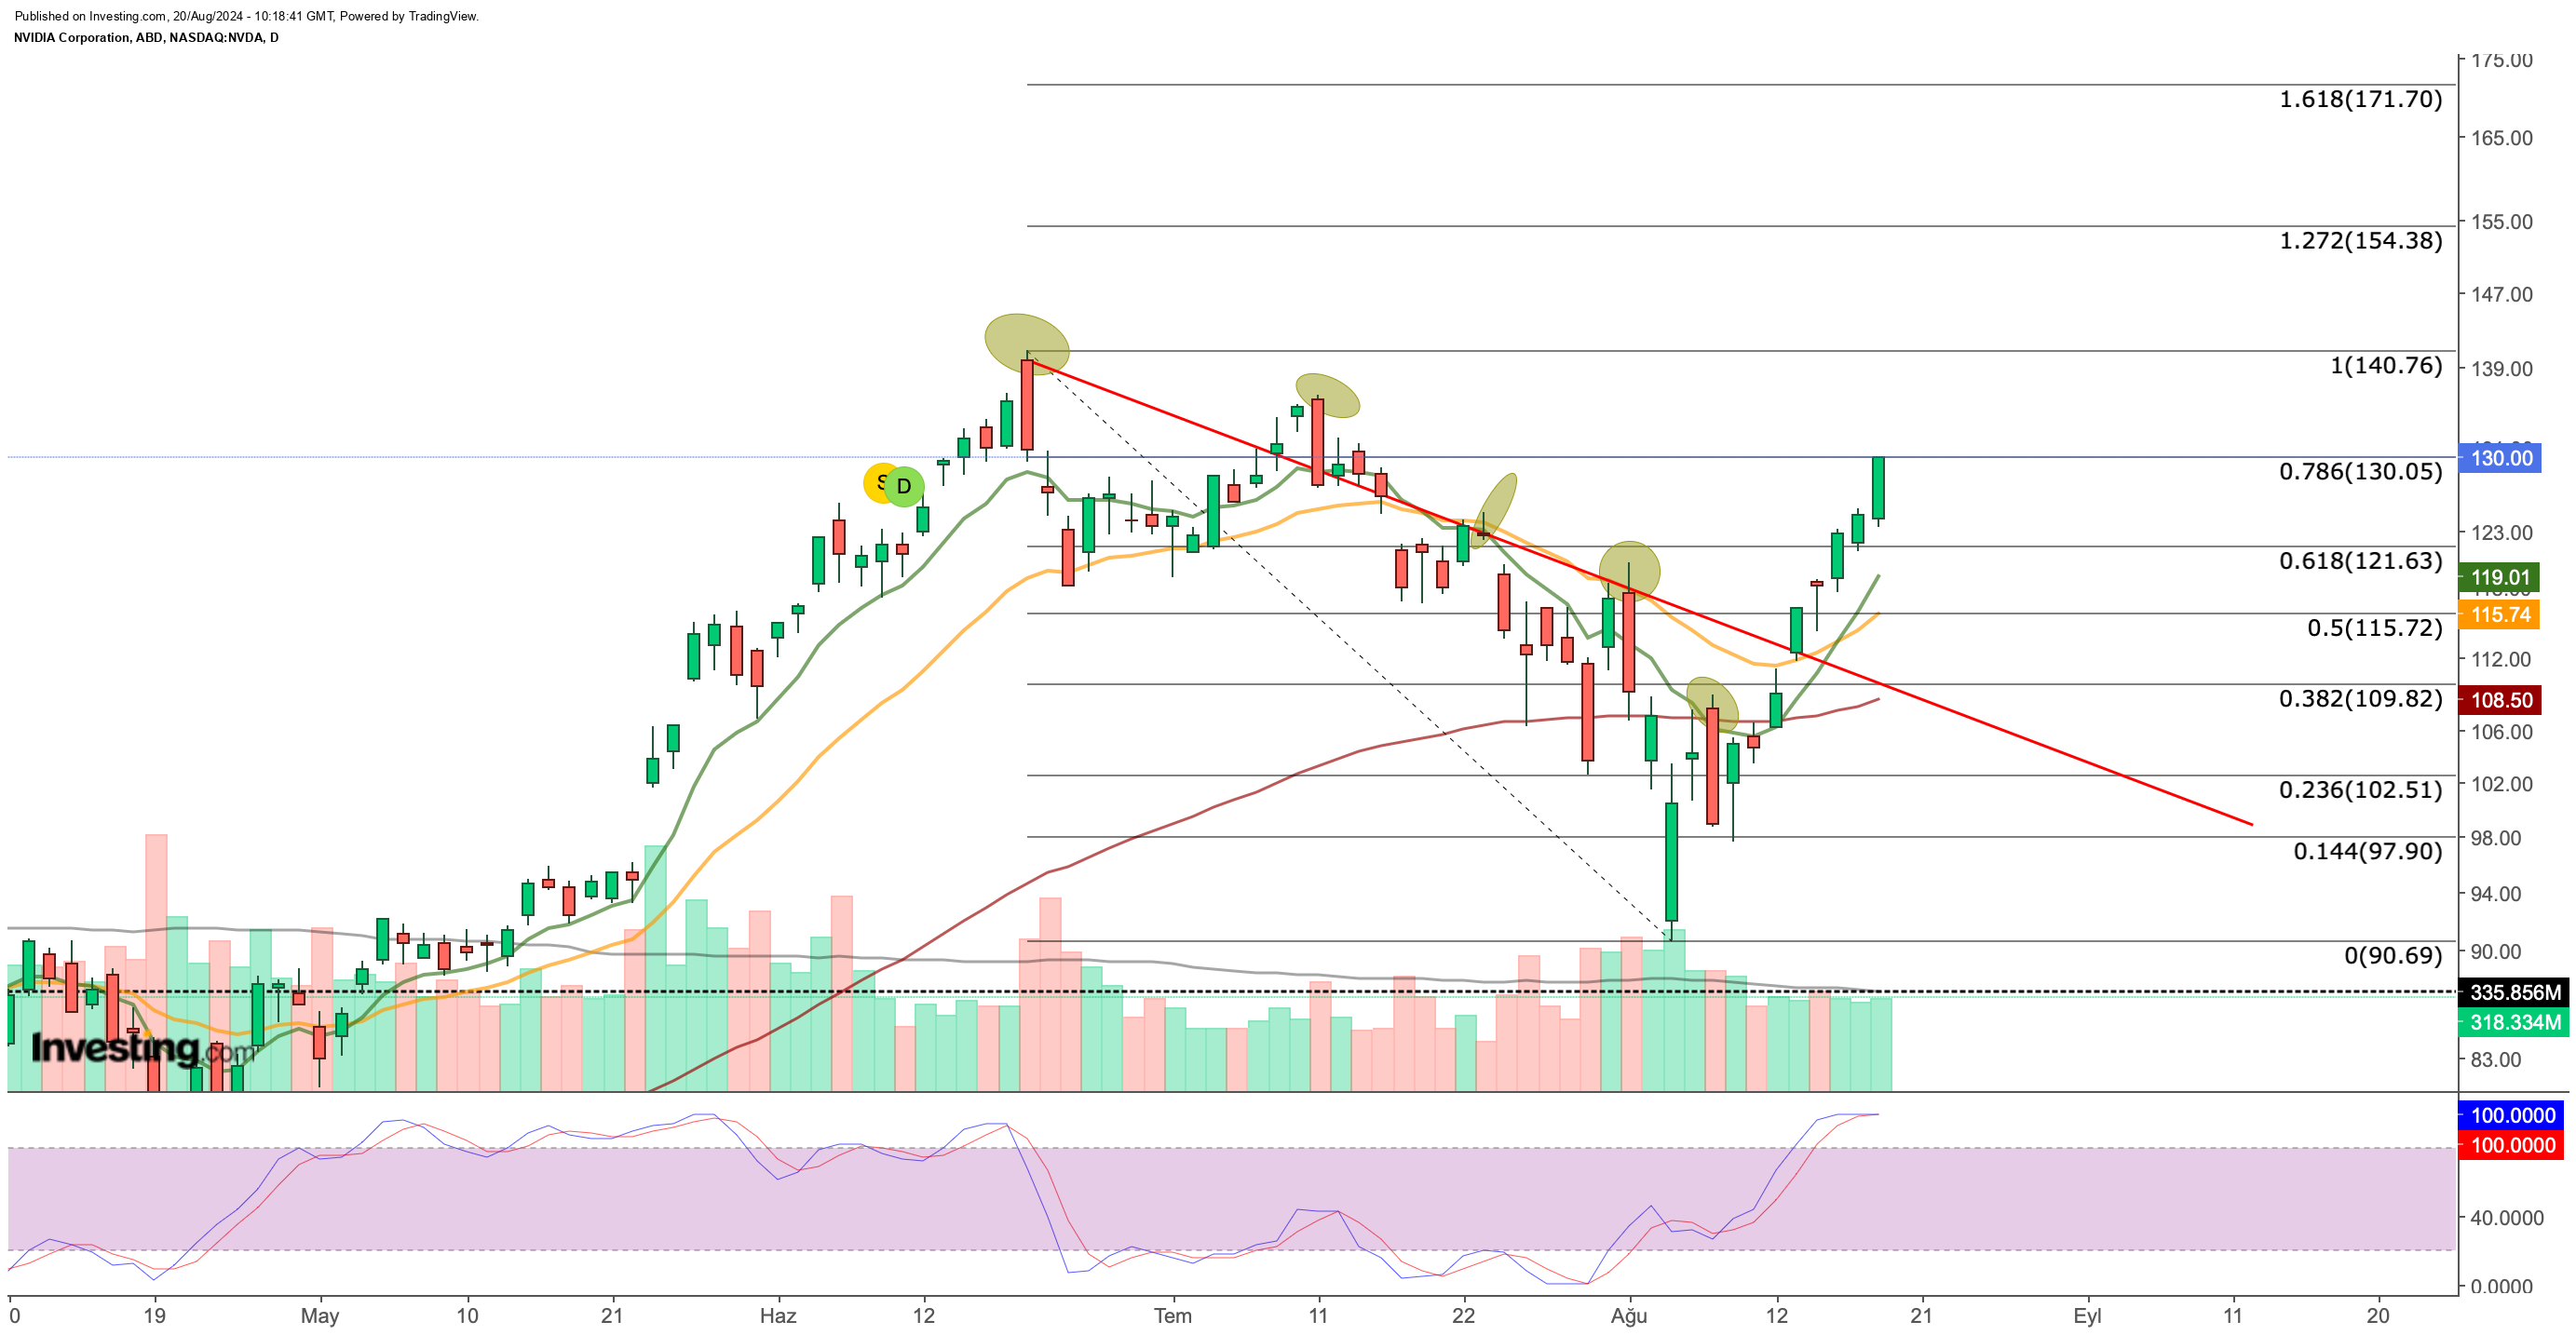
Zooming in on the daily chart, we see short-term resistances emerging during the recovery, again highlighted by Fibonacci levels. Last week, NVDA surpassed a key resistance level with a daily close above $110.
By breaking the short-term downtrend, the stock now targets a critical resistance at the 0.786 Fibonacci level. If NVDA achieves daily closes above $130, we could see buyers push the stock toward its recent peak at $140.

Should NVDA close above $140 this week, Fibonacci expansion levels suggest a potential rise to the $155-170 range. However, given the resistance in the $130-140 range, another wave of profit-taking could emerge if short-term overbought conditions develop.
In this scenario, support around $115-120 could come into play. Below this range, the stock may retest the $105-108 area, where the last downtrend line converges.

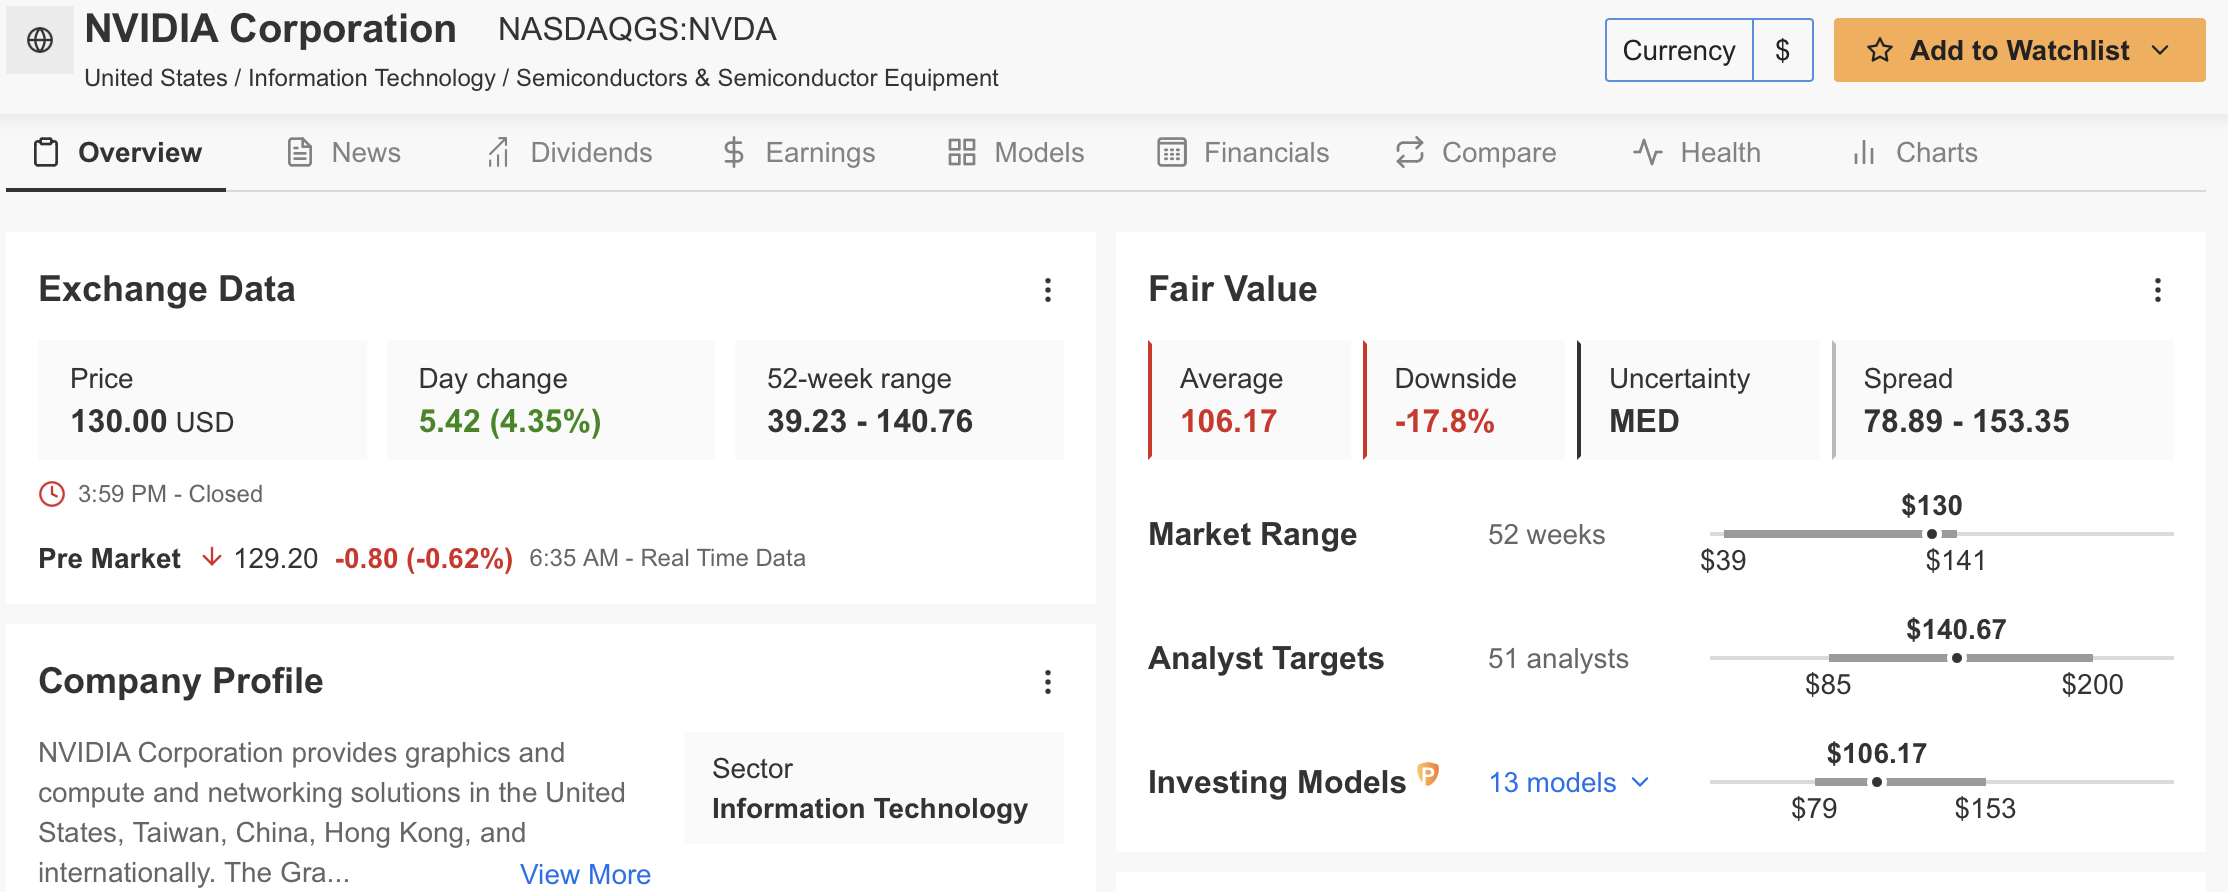
InvestingPro’s Fair Value Tool estimates NVDA’s fair value at $106.17, based on 13 financial models, while the consensus from 51 analysts points to a target of $140.
Next week’s earnings report will likely provide further insight into Nvidia’s trajectory for Q3.
***
Do you wish to discover how to leverage 13F filings to track the latest moves of leading hedge funds and take your investment strategy to the next level?
Join us for an exclusive webinar hosted by Jesse Cohen, senior analyst at Investing.com, and learn how you can copy the latest investments of great investors.
Register now for free, and gain the expertise to make smarter, more strategic investment decisions.
Disclaimer: This article is written for informational purposes only. It is not intended to encourage the purchase of assets in any way, nor does it constitute a solicitation, offer, recommendation or suggestion to invest. I would like to remind you that all assets are evaluated from multiple perspectives and are highly risky, so any investment decision and the associated risk is at the investor’s own risk. We also do not provide any investment advisory services.


