Nvidia Q2 Earnings Preview: Can the AI Frenzy Continue Amid Sky-High Valuations?
2023.08.22 05:34
- Nvidia is set to report Q2 earnings tomorrow after the market closes
- The chipmaker is expected to report strong growth
- Given the sky-high valuations, is growth sustainable in the long term?
All eyes are fixed on Nvidia (NASDAQ:) as the supplier of Artificial Intelligence (AI) hardware and software gears up to report what could potentially be the most important event of the Q2 earnings season.
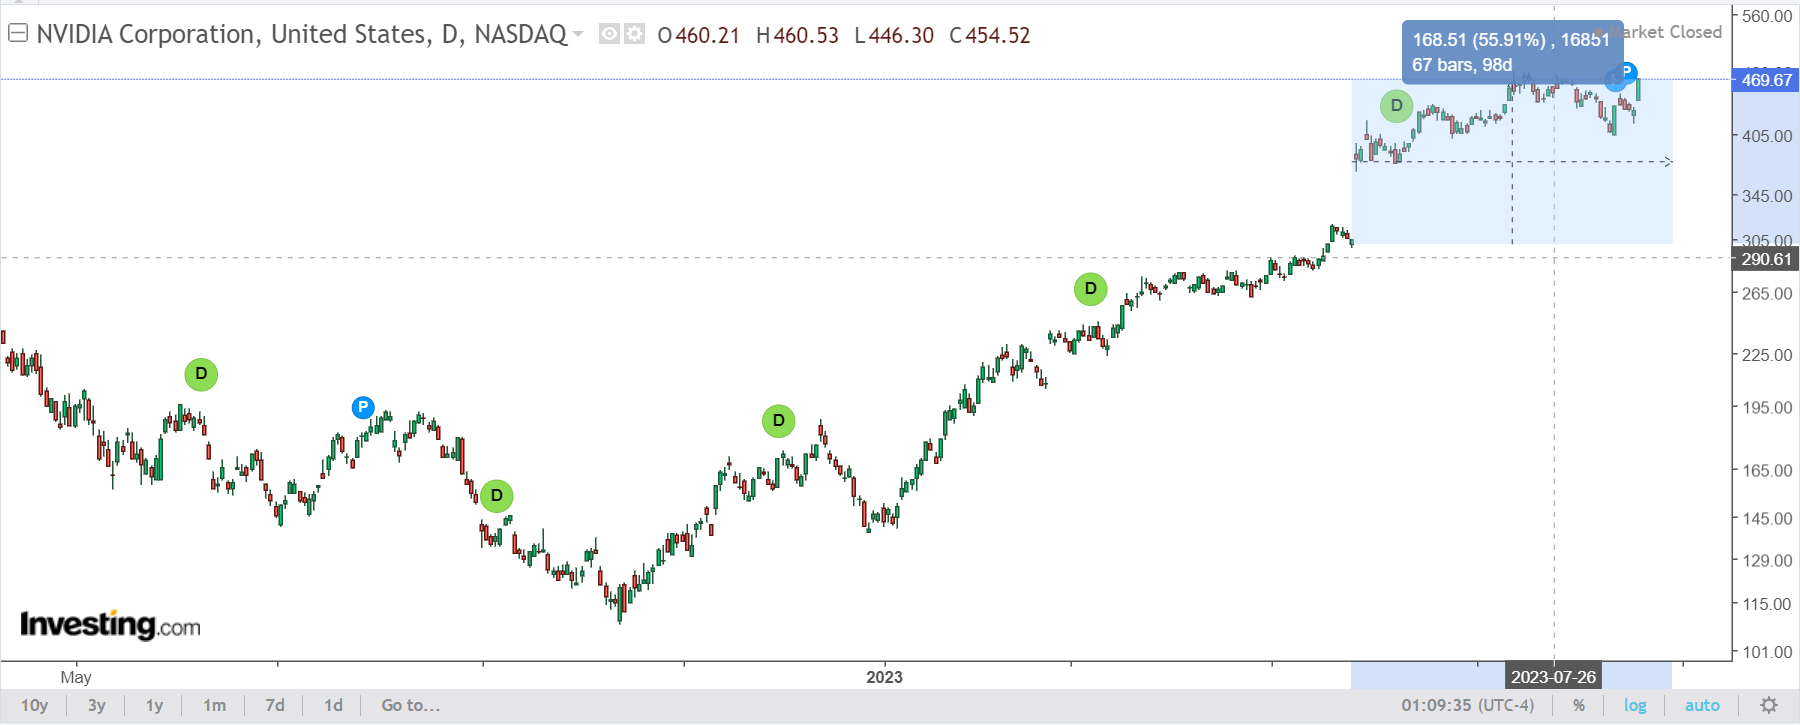
Nvidia’s May sent shockwaves throughout global markets, igniting the AI frenzy that sustained this year’s bullish trend on the , resulting in an impressive 53% surge in the company’s stock since then. This added to the California-based giant’s astounding 221% surge since January.

Notably, the release of Nvidia’s Q1 earnings on May 24 marked the precise moment when the US stock market began to outperform the index for the year, underlining the far-reaching impact of the company’s financial performance on the broader market landscape. US Stock Market Vs. Global Markets This YearSource: Bianco Research
What to Expect From Tomorrow’s Earnings?
Tomorrow’s earnings report is projected to reveal significant growth for the California-based giant. Expected revenue stands at $11.1 billion, showcasing a remarkable 65% increase compared to the same period last year when it was $6.70 billion.
The projected EPS (Earnings Per Share) is anticipated to be $2.09, a substantial rise from the $0.51 reported in the corresponding period last year, indicating a growth of 309%.
Additionally, EBIT (Earnings Before Interest and Taxes) is forecasted at $5.93 billion, a considerable surge from the $1.32 billion recorded in the same timeframe last year, marking a growth of 348%.
These estimations align with the market’s expectations of outstanding growth, predominantly driven by the AI theme that has been a focal point of Nvidia’s operations.
Is the Nvidia Stock Worth it at Current Valuations?
For those familiar with my investment approach, two critical components in any quality/value analysis are robust balance sheets and appropriate valuations.
In the context of Nvidia, the first component, solid indicators of quality such as favorable earnings and revenue trends and a balanced balance sheet, can be acknowledged. However, on the flip side, certain aspects of the cash flow, for instance, the FCF Yield, show notable weaknesses.
In essence, the situation is good but not quite exceptional.
I choose this term carefully because it aligns with the expectations for tomorrow’s quarterly report – the market envisions an astonishing performance. This very narrative has propelled the stock’s price to remarkable heights.
Nonetheless, unfortunately, due to factors like this, the second component, valuation, suffer a significant setback.
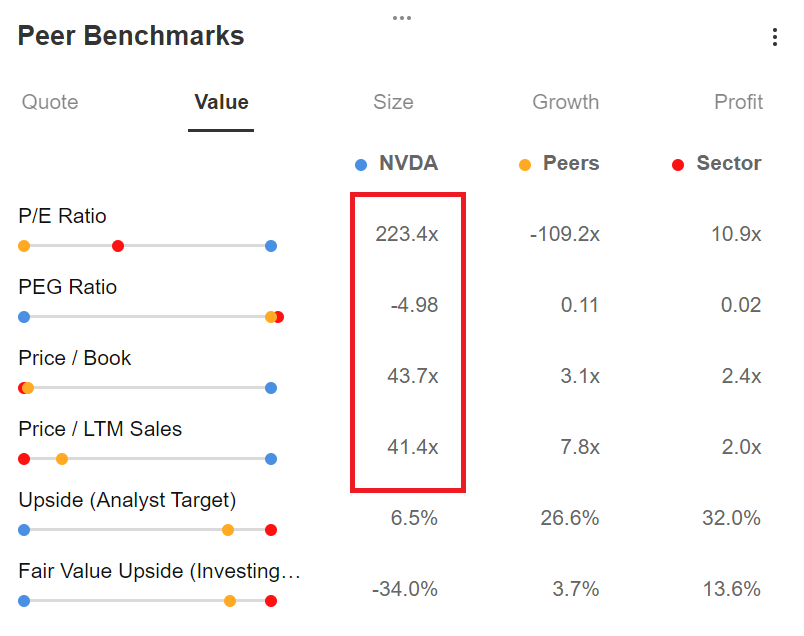
With the help of InvestingPro, we can discern that the stock’s valuation stands not only at an absolute premium but also at a notably elevated level compared to the market and its competitors.

Source: InvestingPro
If we take a closer look at the common indicators, it’s clear that Nvidia’s valuation has gone beyond 40 times its revenues and an astounding 223 times its earnings.
You’re probably aware of how things play out in the market, right? The perception of risk often gets tangled up in the hype among investors.
Stocks with a lot of buzz, like Nvidia, attract buyers because they’re on the rise, hitting new highs, and strangely enough, people start feeling like there’s less risk (even though it’s quite the opposite).
On the flip side, stocks that are plummeting, possibly due to external factors, but eventually become competitively priced and attractive often get abandoned just because they’re labeled as risky.
So, investors should always remember what today’s value of a company really means:
The sum of all its discounted future cash flows.
Now, the major issue with companies like Nvidia is that their sky-high valuations are basically bets on making very ambitious cash flows in the next few years.
If Nvidia’s earnings per share (EPS) exceed $6.4 for the entire year, it would indicate an average growth rate of over 40% for 10 years. The big question is whether this kind of growth, combined with today’s high valuations, can actually be trusted down the road.
To give you an idea, this scenario would mean that in about five years, Nvidia stock could be at $7600, with a total Market Cap that goes beyond $15 Trillion!
Could this really happen?
Well, as narratives stand now, investors could believe this to be the case for a few more months. But eventually, true valuations are going to matter.
***

Find All the Info you Need on InvestingPro!
Disclaimer: This article is written for informational purposes only; it does not constitute a solicitation, offer, advice, counsel or recommendation to invest as such it is not intended to incentivize the purchase of assets in any way. I would like to remind you that any type of assets, is evaluated from multiple points of view and is highly risky and therefore, any investment decision and the associated risk remains with the investor.


