Nvidia Earnings: Export Curbs a Minor Blip as Long-Term Outlook Remains Bullish
2023.11.22 08:58
- Nvidia’s Q3 earnings exceeded expectations, prompting an initial 2.5% decline and later a rebound to close at just under $500.
- Q3 revenue of $18.12 billion, 12.5% above expectations, was driven by robust growth in the data center and gaming segments.
- Despite potential Q4 challenges, Nvidia remains optimistic, with analysts forecasting upward revisions and a consensus share price target of $642.
- Unlock the potential of InvestingPro for up to 55% off this Black Friday and never miss out on a market winner again.
Despite Nvidia’s (NASDAQ:) Q3 significantly surpassing expectations, investors initially chose to divest. Nvidia stock has surged by 242% YTD to reach the $500 mark, but the chipmaker’s earnings report triggered a 2.5% decline after the release.
However, a shift occurred later in the day as buyers re-entered the market, and the stock closed at just under the $500 threshold. This response contrasts with the company’s initial post-report movements earlier in the year, where NVDA stock rallied following first-quarter results.
This can be attributed to the company’s quarterly results surpassing expectations and the partially pessimistic outlook provided by company officials for the last quarter.
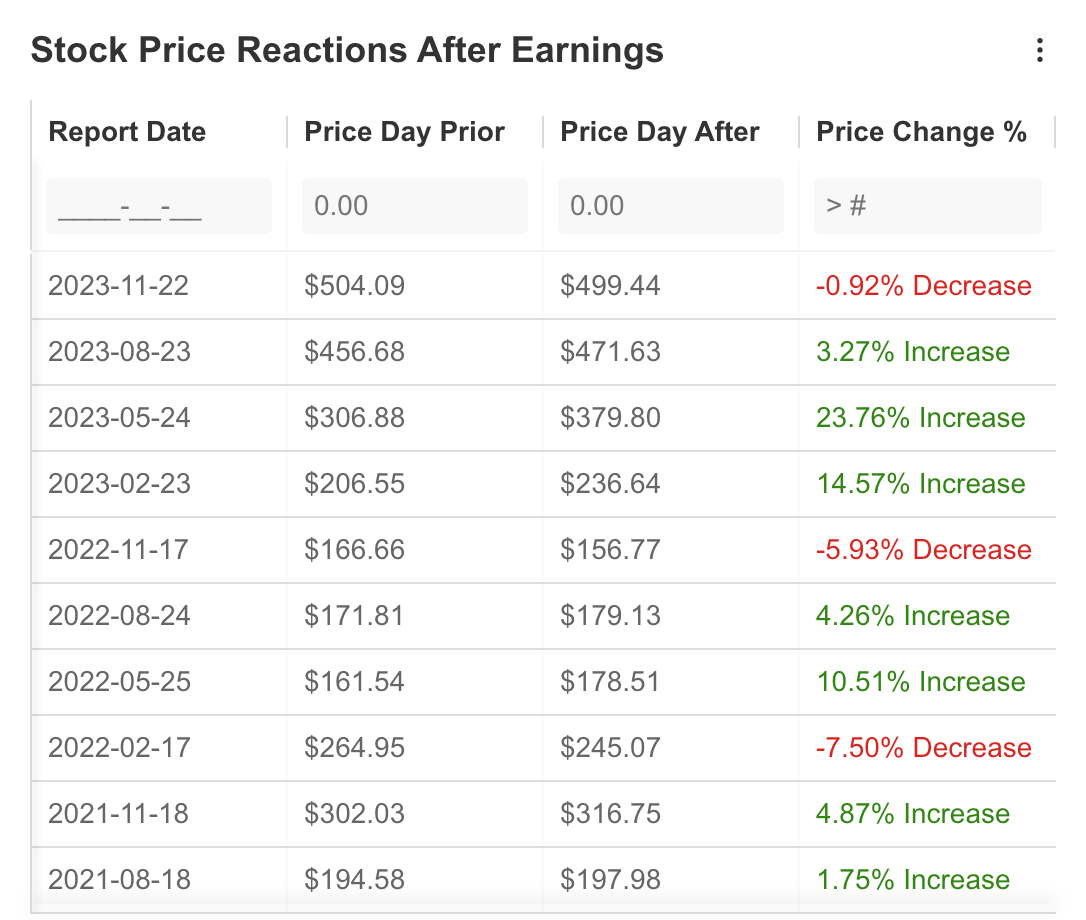 Nvidia Stock Reaction to Earnings
Source: InvestingPro
In its Q3 results, the company reported revenue of $18.12 billion, 12.5% above InvestingPro expectations. The company’s profit per share was also announced as $4.02, exceeding the expectation by 18%. Thus, the company reached 206% year-on-year revenue growth and continued its strong outlook in the second quarter in the last quarter.
Looking at the distribution of the company’s revenue, it was seen that data center revenues had a significant share with $14.5 billion. Sales to cloud providers accounted for the largest share of the higher-than-expected data center revenue growth. The company nearly doubled its sales in the gaming segment compared to last year, generating $2.86 billion in revenue.
The main factor in Nvidia’s upward trend throughout the year was the demand for artificial intelligence, which positively affected many sectors. The fact that companies turn to artificial intelligence software and Nvidia offers the necessary hardware in this field is seen as the biggest factor in the exponential increase in revenue.
Speaking about artificial intelligence, Jensen Huang, founder and CEO of Nvidia, said that their strong growth was triggered by the transition from general-purpose to accelerated computing and the artificial intelligence industry. Huang also added that companies will continue to invest in artificial intelligence at a rapid pace, and he thinks they will maintain their growth momentum in this area.
Management Optimistic Despite Export Restrictions
In addition, the company said in a post-earnings statement that it expects some of the US Government’s restrictions on exports to hinder Q4 earnings. The US government announced new licensing requirements for exports to some countries such as Saudi Arabia, the United Arab Emirates, and Vietnam, along with China. Nvidia is nonetheless optimistic about the challenge and expects its rapid growth in other regions to offset the potential loss of revenue.
This may have caused unease among some investors, as the share price fell slightly after the earnings report and demand did not pick up quickly in response to the strong gains. This, of course, can be interpreted as buying the expectation and selling the realization during the quarter.
Source: InvestingPro
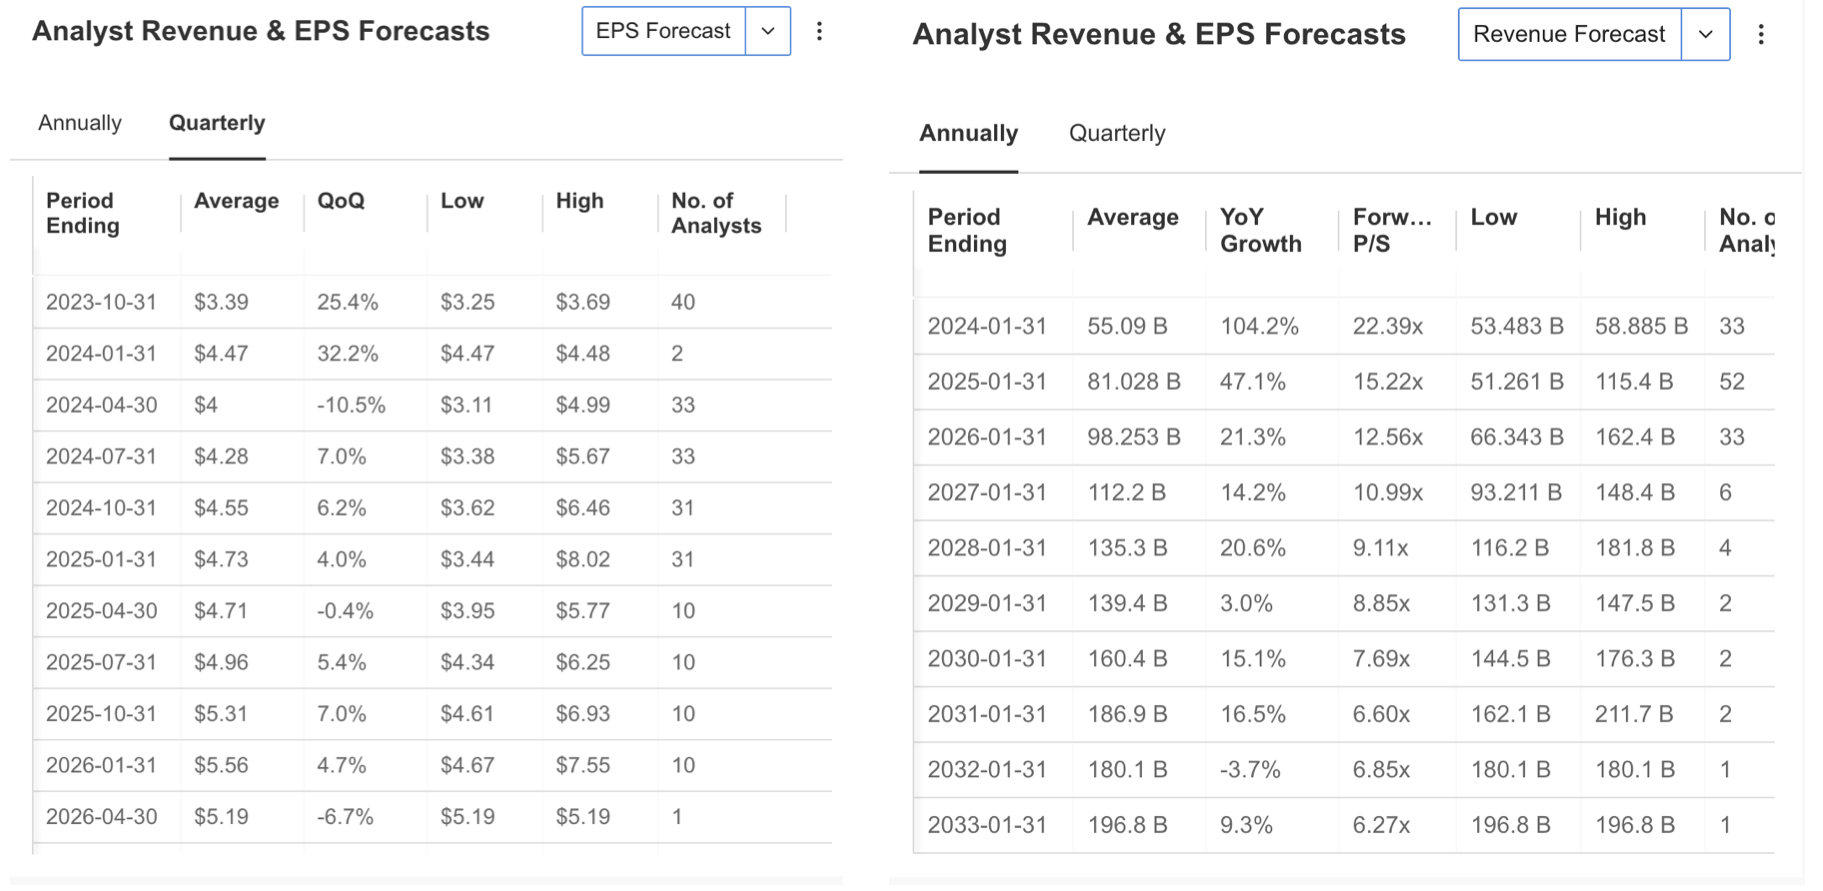
If we check the Q4 forecasts on InvestingPro; we can see that 39 analysts have revised their expectations upwards in the last 3 months. Accordingly, EPS expectations for Q4 results, which are expected to be announced on February 15, are estimated at $4.47, up 32%. The year-end revenue forecast is currently projected at $81 billion, up 47% year-on-year. However, analysts are likely to revise their estimates upwards during the relevant period.
Nvidia’s Financial Health Remains Solid
According to Nvidia’s financial situation on an annual basis, the company’s prominent positive aspects are listed as follows in the summary information compiled on the InvestingPro platform:
- Strong returns in the last month
- Dividend payments supported by strong earnings
- Cash flow is sufficient to cover interest expenses
- Continued increase in net profit
The two warning signs for NVDA stock are that the stock currently has a high P/E ratio and the price movement is quite volatile. Because the company’s 5-year beta average of 1.67 is an important indicator that the price volatility is high compared to the market.
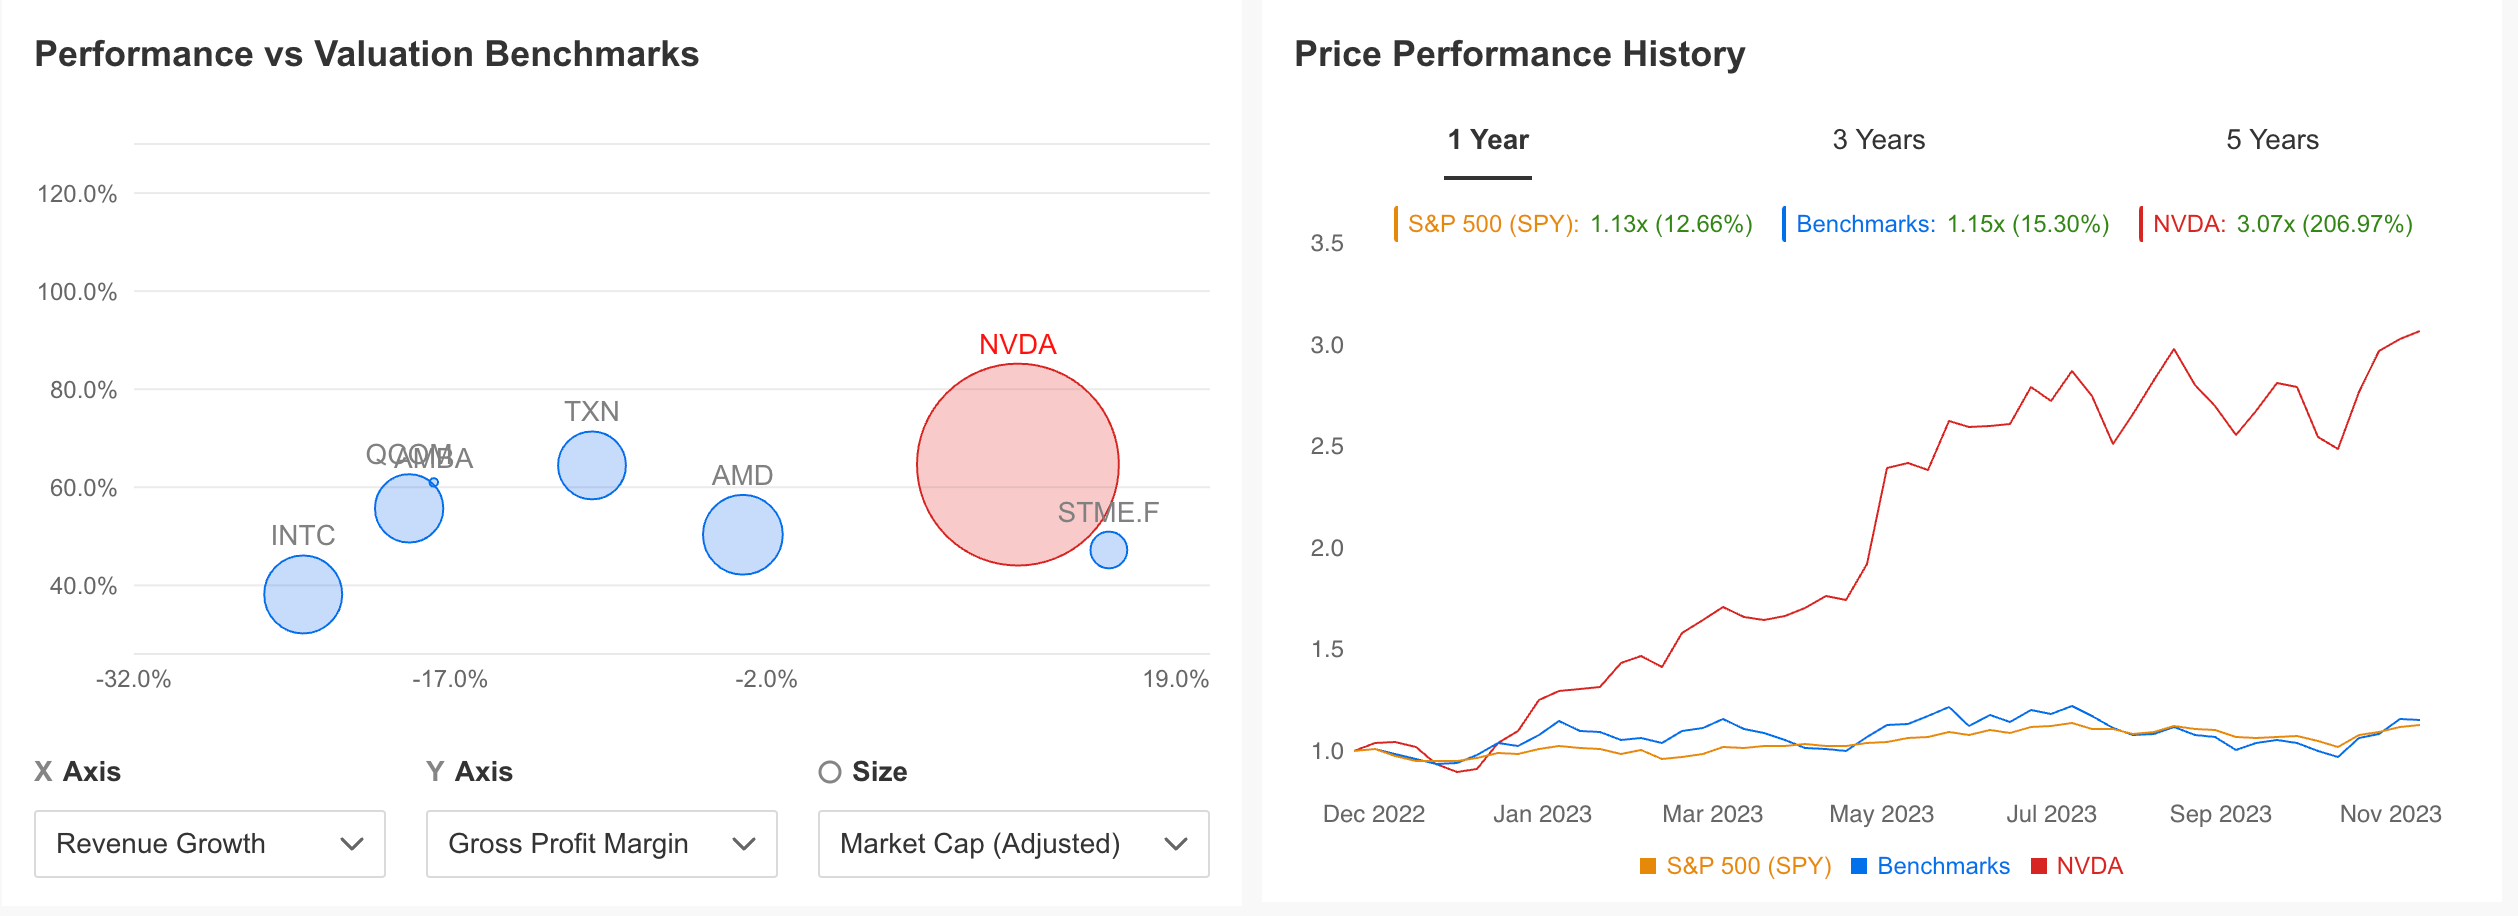 Performance Vs. Valuation
Source: InvestingPro
When we compare Nvidia with peer companies in the industry according to revenue growth and gross profit margin, we can see that the company is in an advantageous position. This strong outlook is also reflected in the performance of the share price. As can be seen in the chart below, NVDA stock outperformed the and competitor average by 3 times on an annual basis.
Source: InvestingPro
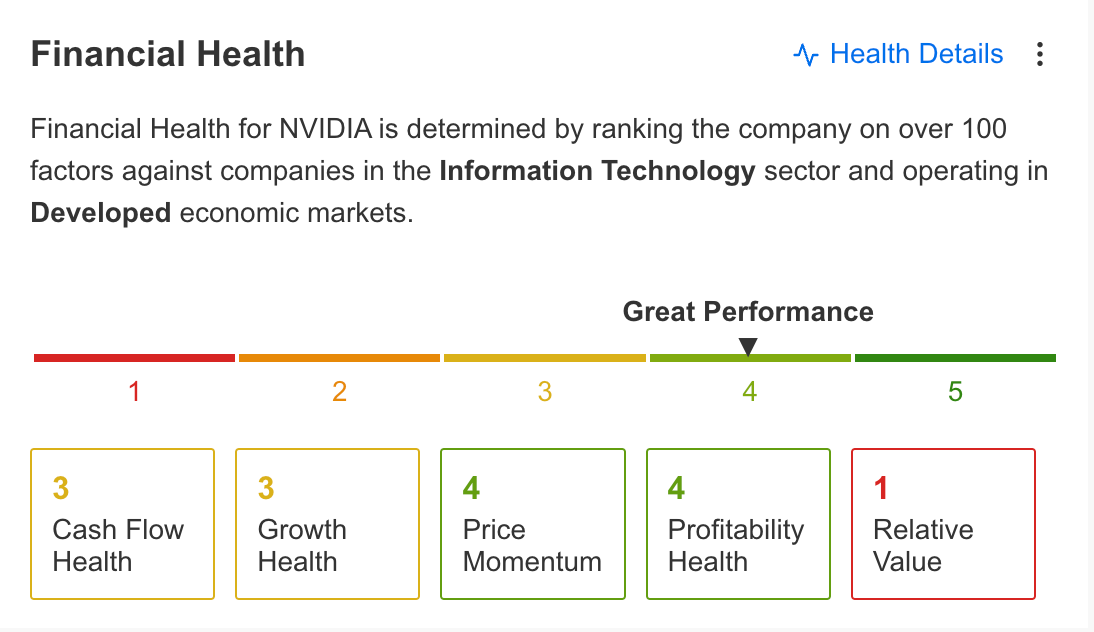
In addition, the company’s financial health has a strong performance with a score of 4 out of 5. Cash flow and growth items continue to perform well, while price performance and profitability health remain the company’s strengths.
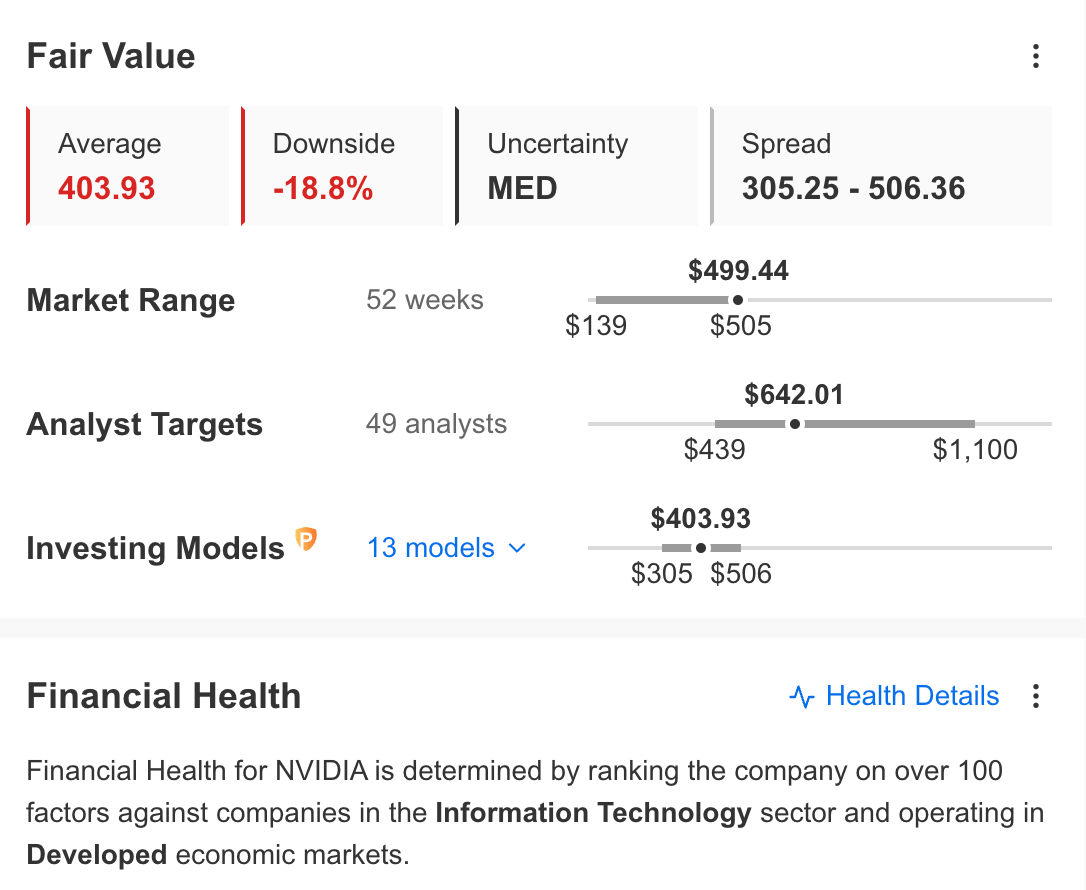
Analysts forecasting the price of NVDA stock also predict that the upward trend may continue in the next one-year period. Accordingly, the consensus forecast of 49 analysts is that the share price could rise to $ 642.
Source: InvestingPro
According to InvestingPro’s fair value analysis, the calculation made with current financial models predicts a correction towards $403, while we may see an upward correction in the forecast during the last quarter after financial results exceeded expectations.
Nvidia Stock: Technical Outlook
When looking at the NVDA share from a technical point of view, the first striking appearance is that the share price has started to move horizontally in the Fibonacci expansion area according to the long-term outlook.
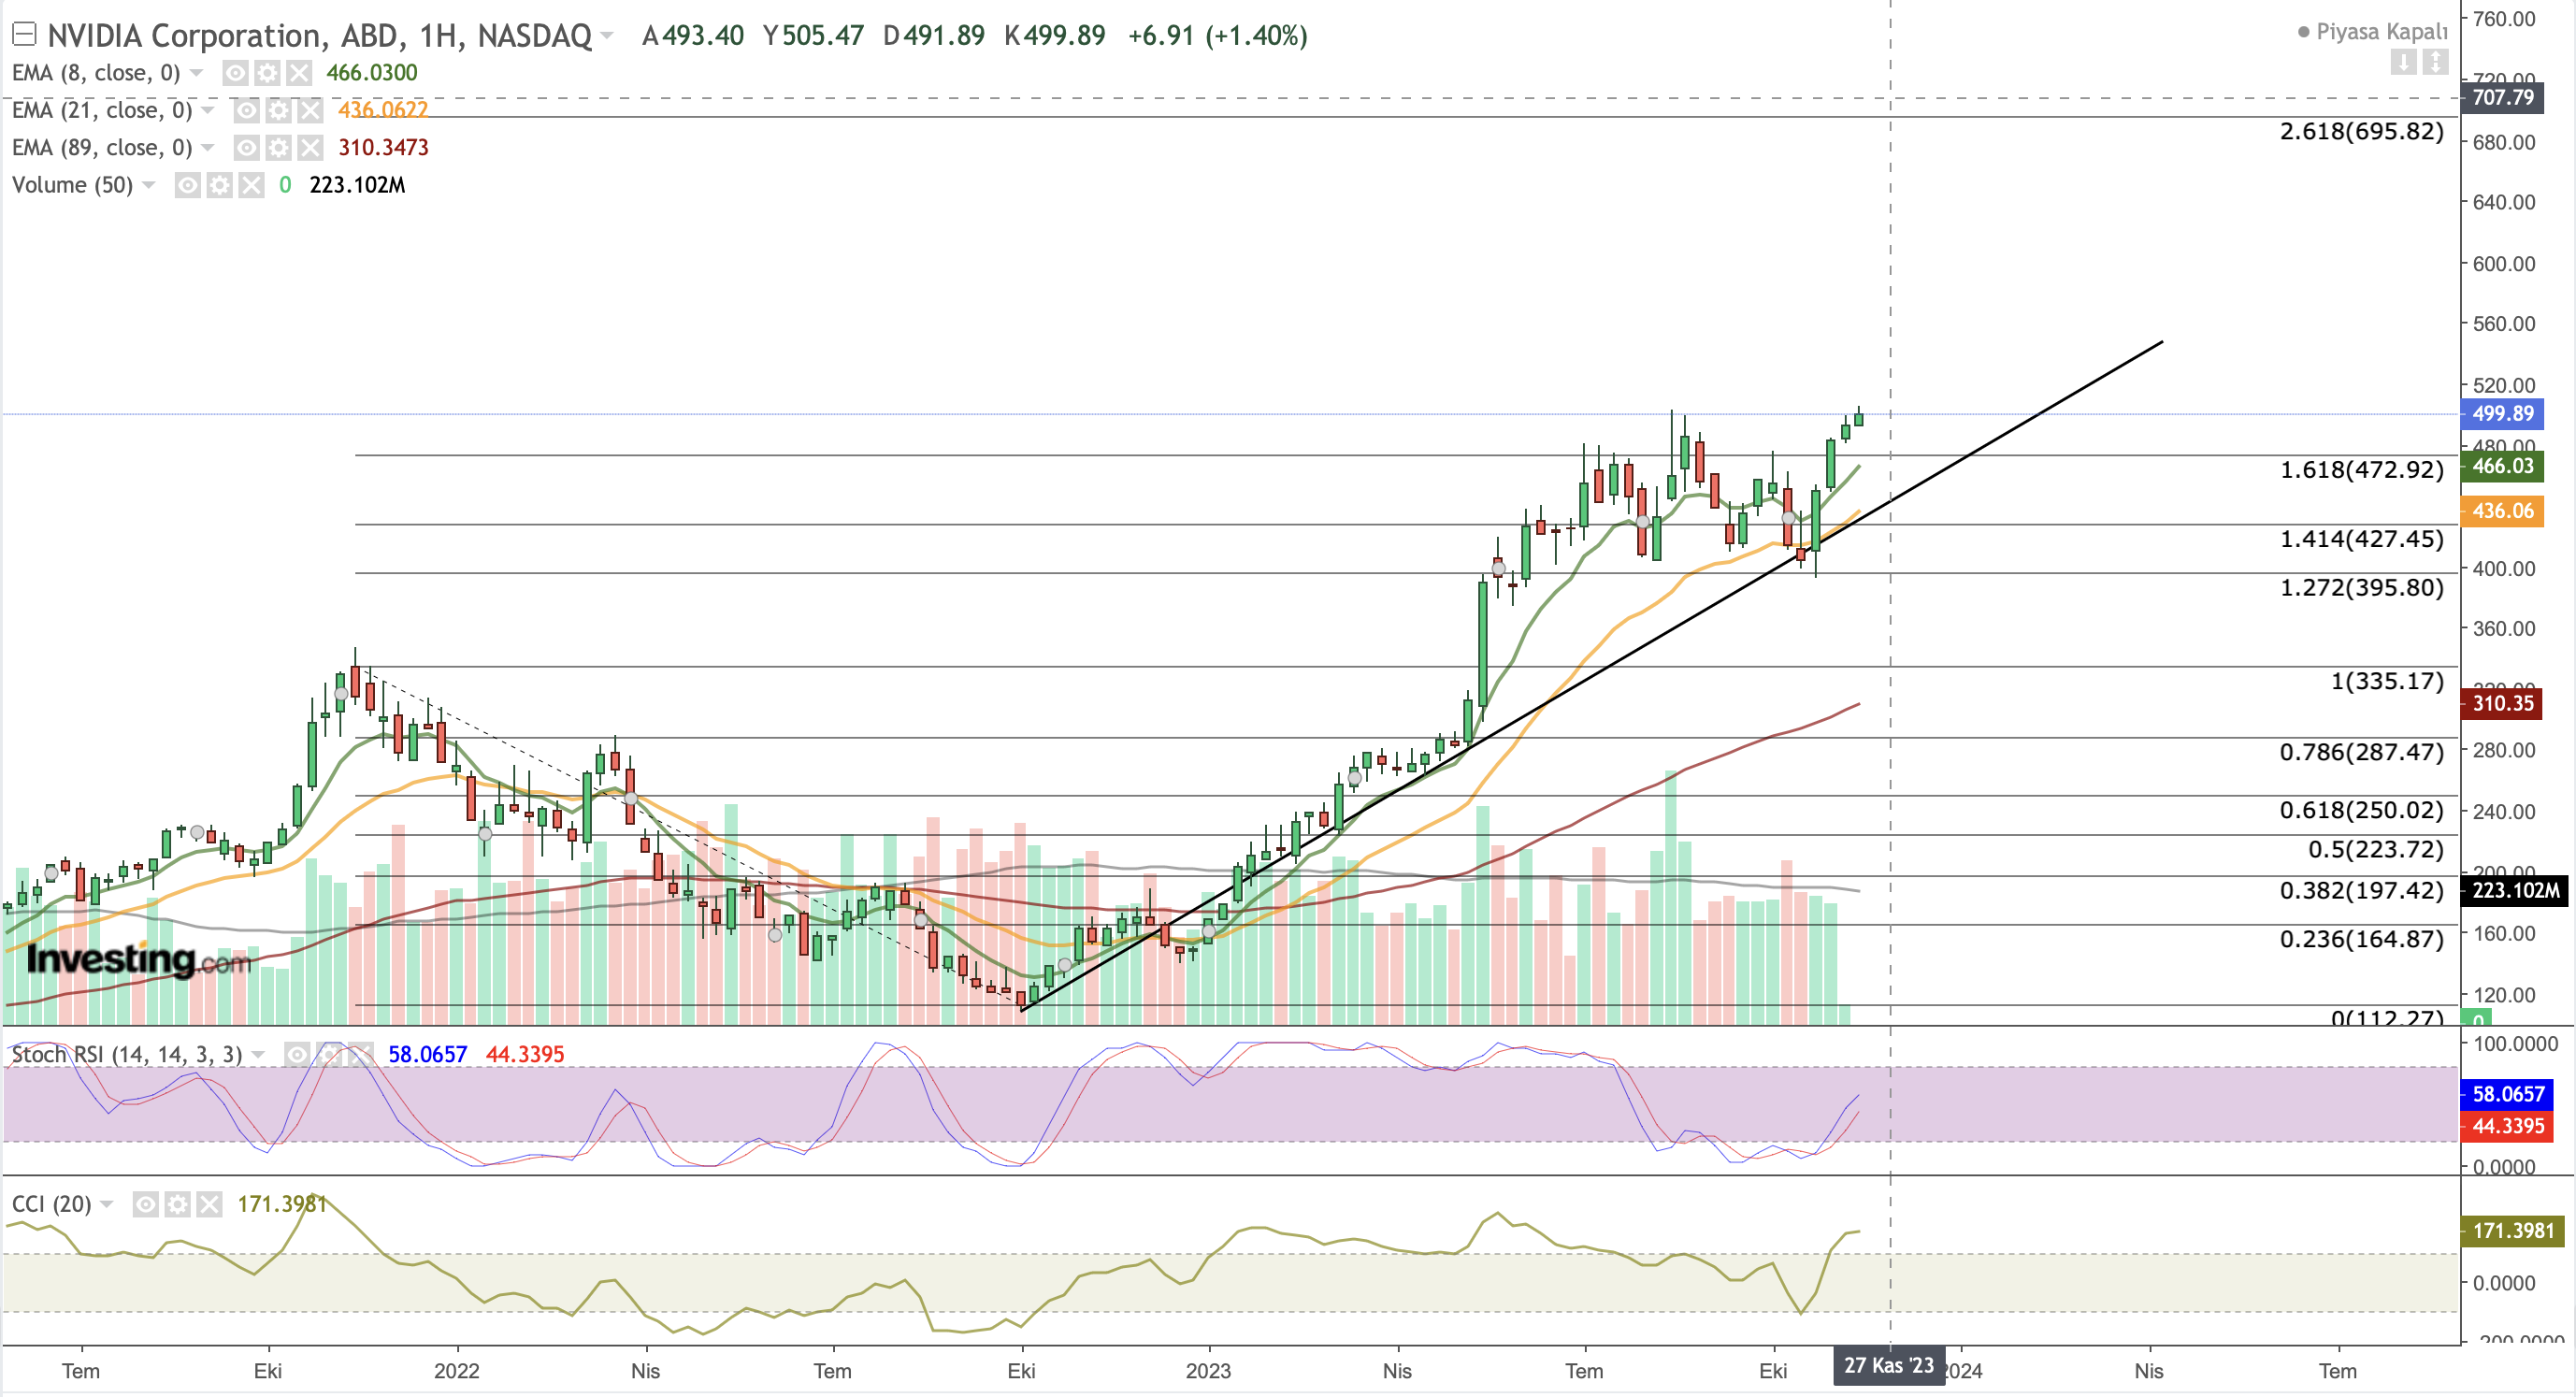
The share, which entered an uptrend in October last year, gained value rapidly until the first half of this year and then started to lose momentum as well as maintaining its trend. Based on the last downtrend, it is seen that the horizontal outlook was realized in the range of Fib 1,272 – Fib 1,618.
On the other hand, NVDA, which recorded a new record high of $ 505 this week, is in the process of turning its last resistance at an average of $470 into support. If buyers manage to keep the share price above this price, we can see that the trend may turn up again and move towards $ 700.
However, the fact that the loss of revenue for export restrictions in Q4 was above expectations may make investors nervous and we may see that the stock may return to its movement in the channel according to the news flow that could continue until the end of the year.
Accordingly, if NVDA realizes a weekly close below $470, the average of $430 can be followed as an intermediate support. If this support is broken, the price may fluctuate below $ 400.
This indicates an increased risk of the start of the correction phase in NVDA. We can see that a possible medium-term correction could continue to the levels of 280 – 300 dollars.
However, the company’s strong outlook and technical outlook suggest that an upward move is more likely than a correction.
***
Missed the Last Market Winner? No Problem, Get a Second Chance This Black Friday!
We know how hard it can be to miss the boat on high-flying stocks that were just waiting to be scooped up.
That’s why, this Black Friday, we’re offering you an up to 55% discount on InvestingPro subscription plans. Know first, know better, and make sure to never miss out on a winner again.

Black Friday Sale – Claim Your Discount Now!
Disclaimer: The author does not own any of these shares. This content, which is prepared for purely educational purposes, cannot be considered as investment advice.


