Netflix Stock Slides on Earnings Miss: Time to Buy the Dip?
2023.07.21 10:21
- Netflix’s revenue missed expectations in Q2, but profit per share exceeded estimates
- The stock dropped after the earnings report but is still up 48% YTD
- But, it still trades at a discount to its fair value, according to InvestingPro
Earlier this week, Netflix (NASDAQ:) disclosed its second quarter , but to the dismay of investors, the revenue fell short of estimates.
The disappointing results sparked a negative response from Wall Street, prompting an 8.5% decline in the stock. The reported revenue for the second quarter was $8.19 billion, missing expectations by approximately $100 million.
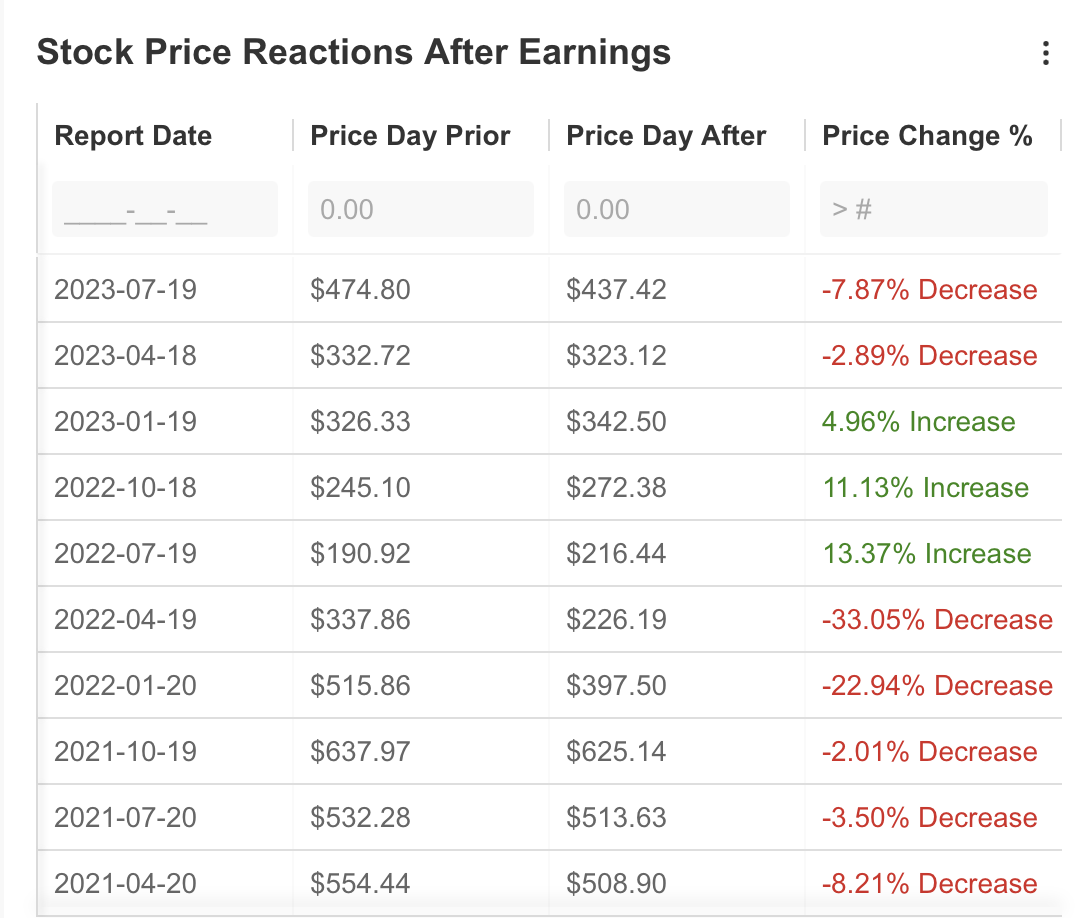 Stock Reaction After EarningsSource: InvestingPro
Netflix, despite announcing revenue below expectations, managed to surprise investors with its profit per share, which exceeded the InvestingPro forecast. The company reported a profit per share of $3.29, surpassing the expected value of $2.84 by an impressive 15%.
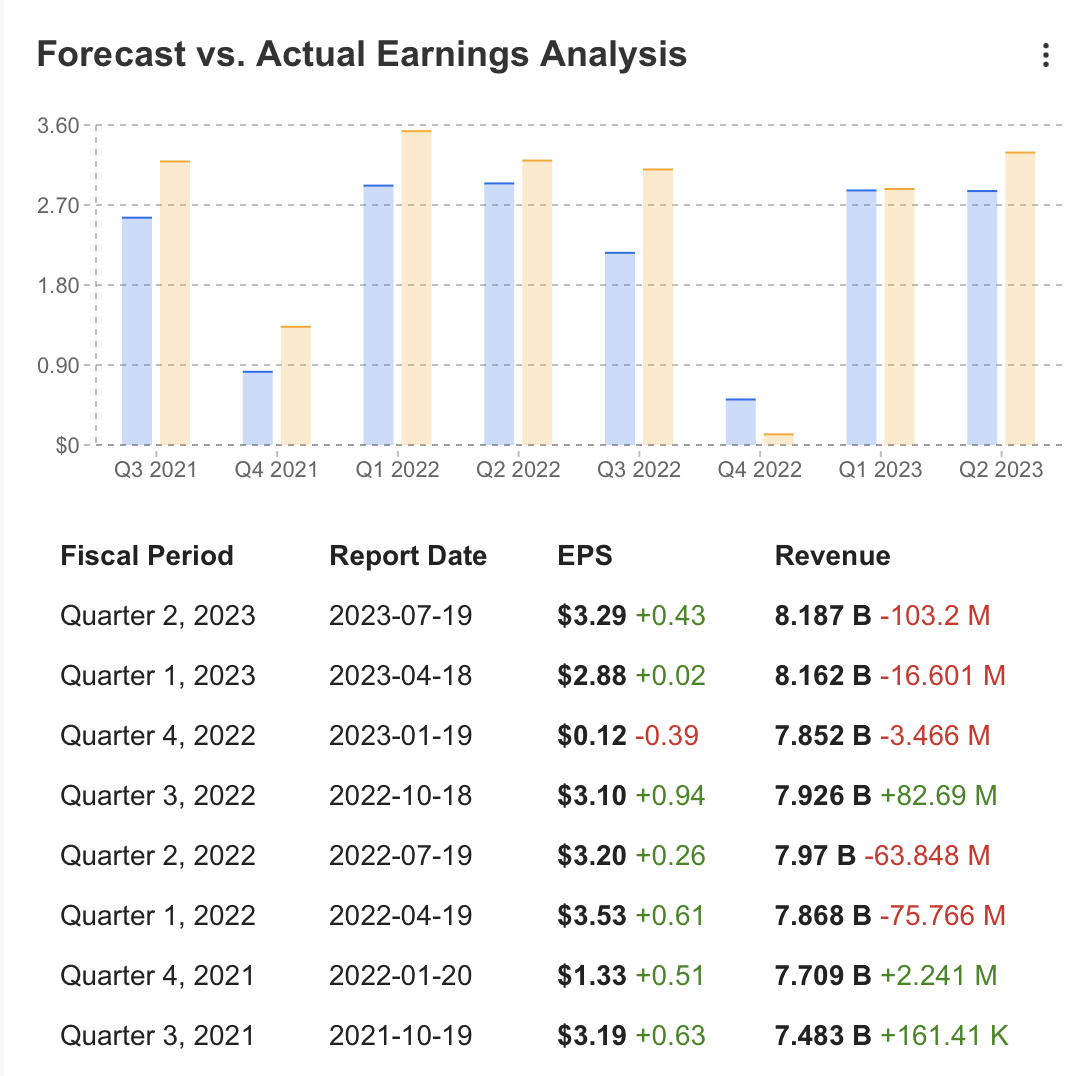 Source: InvestingPro
The stock experienced a sharp decline after the earnings report, which can be attributed to both lower-than-expected growth and investors cashing in their profits. However, despite the setback, the streaming giant’s stock has been on an uptrend since the second half of the previous year, boasting an impressive 48% increase in value since the beginning of this year.
To combat the increasing competition in the broadcasting industry, Netflix has adopted new strategies to maintain its market share. One recent example is the introduction of an advertised content tariff, offering a cheaper price while aiming to increase advertising revenues alongside the number of subscribers. With this approach, Netflix expects revenue growth to pick up pace in the latter half of the year.
As of June, the company had reached an impressive 238.4 million subscribers, gaining nearly 6 million subscribers this quarter, far surpassing the expectations of 1.9 million. Despite the challenges faced by the industry and the recent disappointing earnings report, the overall outlook remains positive, fueled by confidence in its strategic vision.
One significant challenge is the ongoing strike by Hollywood actors and writers, which has resulted in delays in numerous movie and television productions. However, thanks to its global broadcast production dynamics, Netflix is better positioned to navigate this challenge compared to its competitors. Additionally, reduced payments for canceled broadcasts could potentially improve Netflix’s cash flow by up to $5 billion.
Looking ahead, the forecasts for the remainder of the year are optimistic. While revenue growth for the last three months increased by 2.7% compared to the same period last year, it was perceived as slow growth. For the upcoming third quarter, Netflix is anticipating $8.5 billion in revenue, aligning with the forecast on the InvestingPro platform. The company’s primary goal is to accelerate growth, even though Q2 sales and Q3 revenue projections fall below some market forecasts. However, Netflix cautioned that achieving this growth might take time.
Notably, 21 analysts have revised their views upwards on the platform, reflecting positive sentiment. The revenue expectation for the next quarter stands at $8.51 billion, with an earnings per share forecast of $3.49.
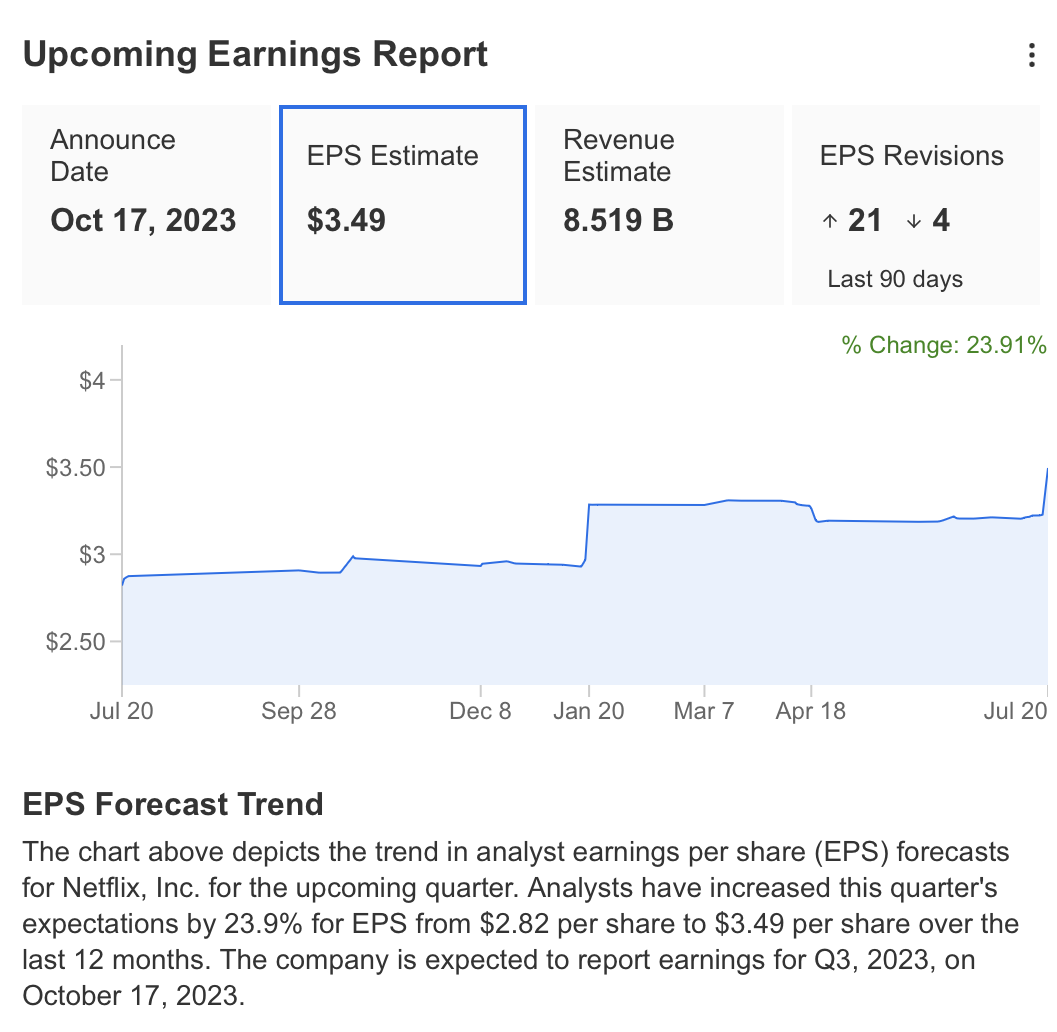 Source: InvestingPro
Longer term forecasts for revenue and earnings per share on an annualized basis are as follows:
 Analyst Revenue and EPS ForecastsSource: InvestingPro
Revenue growth for the company is expected to be driven by pricing adjustments, an increase in subscriber volume, and a boost in advertising revenue. Although the advertising tariff, introduced in November last year, may not make a significant contribution this year, a gradual increase is anticipated over time.
The Q2 results showcased notable highlights in the company’s profitability growth and a considerable increase in free cash flow, reflecting positive developments in its financial performance.
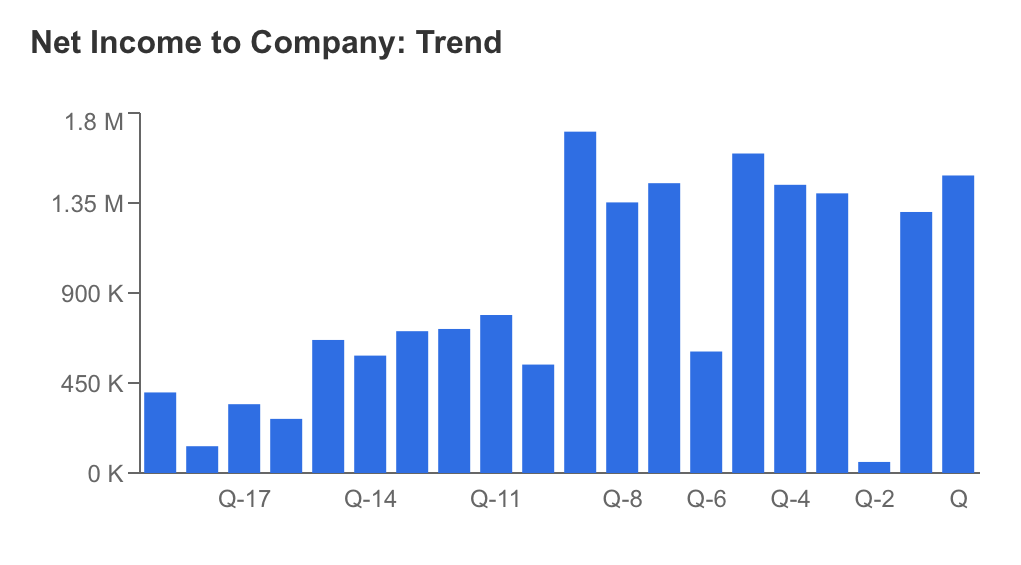 Net Income to Company TrendSource: InvestingPro
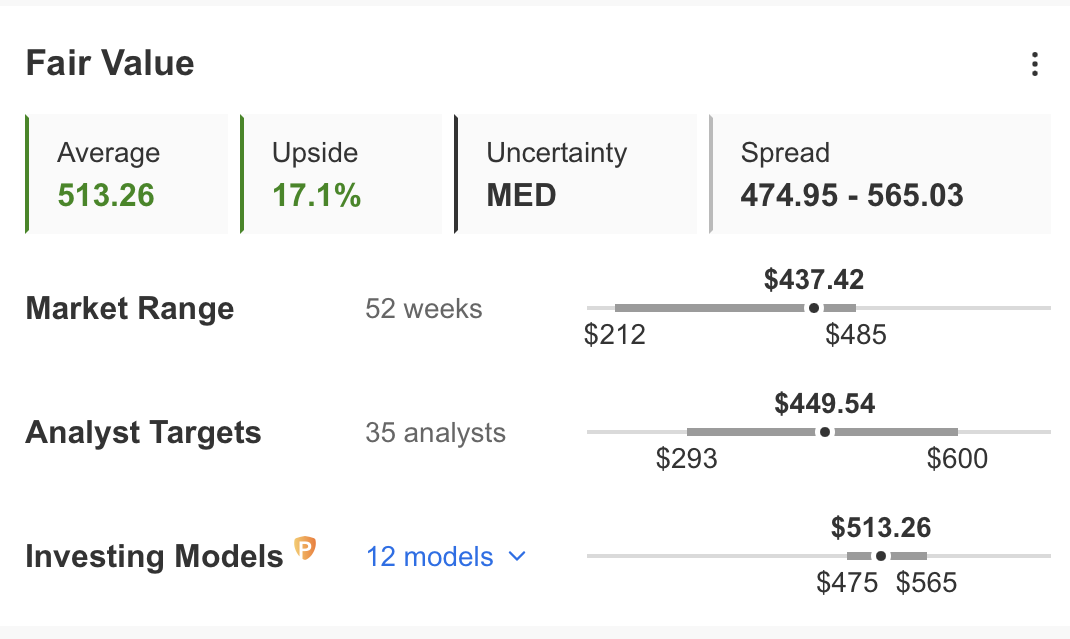
On the InvestingPro platform, the fair value estimates for NFLX indicate a value of $513, calculated based on 12 different models. This estimation suggests that the stock is currently trading at a 17% discount compared to its current market price.
Furthermore, considering the average price forecast provided by analysts, the projected price stands at $450.
 Source: InvestingPro
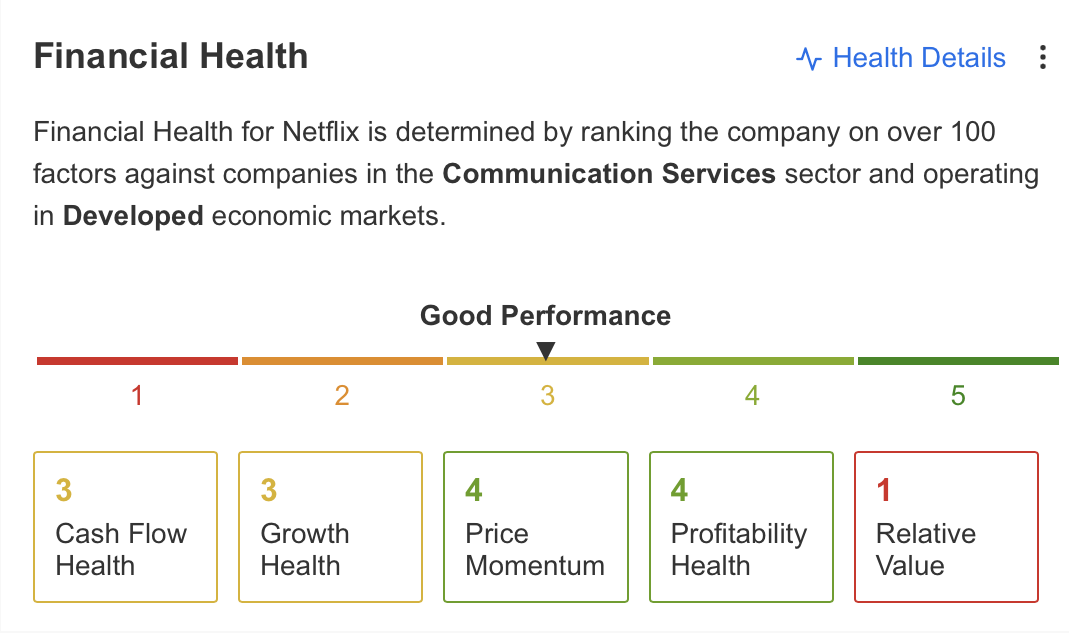
Netflix’s financials show a positive overall outlook, with the company maintaining good performance. The share price momentum and profitability remain strong, while cash flow and growth are at average levels presently. However, the company continues to face challenges related to its relative value, which is seen as a hindrance to further progress. Despite these obstacles, Netflix continues to demonstrate a healthy performance in various aspects of its business.
 Source: InvestingPro
The slowdown in revenue growth is indeed viewed as a concerning factor for Netflix. However, investors will closely observe the company’s commitment to focusing on growth strategies to address this issue. Another drawback for investors is the absence of dividend distribution.
Despite consistently growing its subscriber base, Netflix might not immediately achieve the revenue levels that reflect this expansion. As a result, the company’s performance may continue to be under scrutiny by long-term investors, contingent on its ability to sustain steady growth and navigate challenges within the industry. The company’s future prospects and its ability to overcome sector-specific obstacles will play a crucial role in determining its appeal to long-term investors.
Netflix: Technical Outlook
The stock has been in a positive trend and in recovery mode over the past year. This recovery comes after a significant and rapid decline experienced in the first half of the previous year.
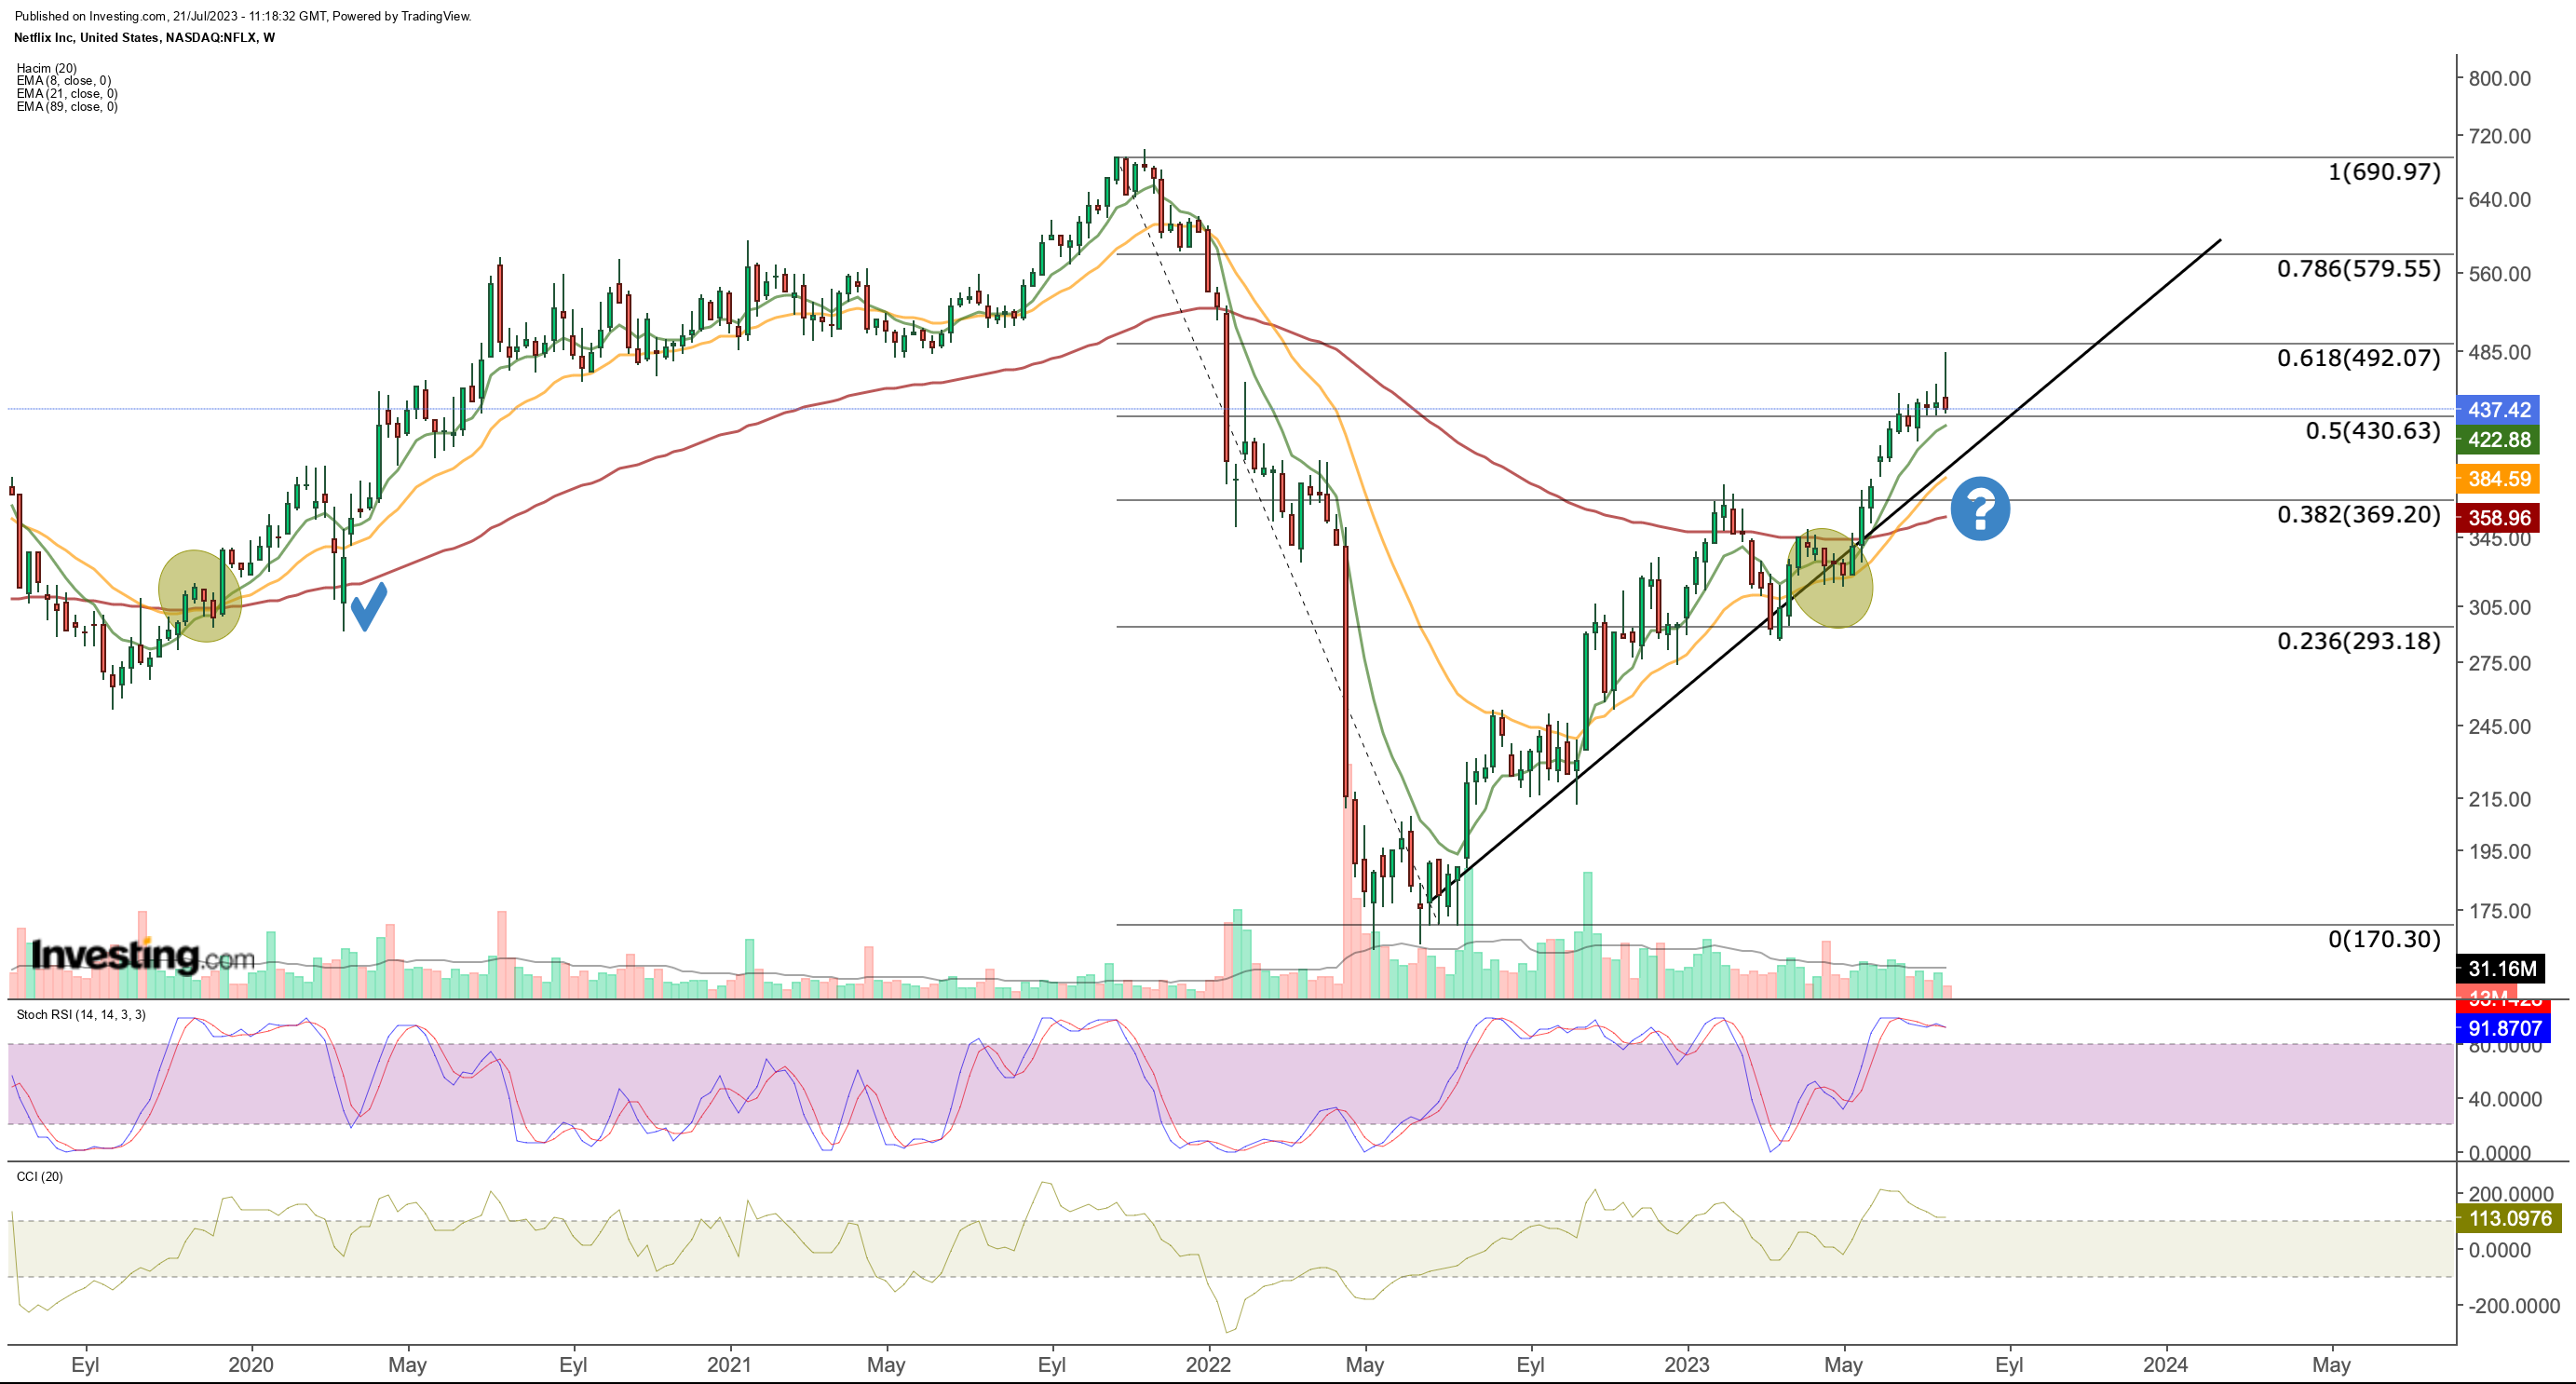
Taking a closer look at the technical chart, it appears that the upward momentum has been gradually decreasing over the past month. However, as long as the stock maintains its support level at around $430, the upward trend could potentially continue.
On the other hand, there is a critical resistance level at an average of $490, which has been acting as a significant hurdle recently. If the stock manages to close above this value consistently on a weekly basis, it may signal a strong potential for further upward movement. In such a scenario, the stock could aim for higher price levels within the range of $580 to $690 in the coming periods.
Moreover, the upward intersection of EMA (Exponential Moving Average) values, along with the break of the $370 resistance in May, adds strength to the overall bullish trend. In case of a potential correction, $370 could become a key support level to watch for.
***
Access first-hand market data, factors affecting stocks, and comprehensive analysis. Take advantage of this opportunity by subscribing and unlocking the potential of InvestingPro to enhance your investment decisions.
And now, you can purchase the subscription at a fraction of the regular price. Our exclusive summer discount sale has been extended!
InvestingPro is back on sale!
Enjoy incredible discounts on our subscription plans:
- Monthly: Save 20% and get the flexibility of a month-to-month subscription.
- Annual: Save an amazing 50% and secure your financial future with a full year of InvestingPro at an unbeatable price.
- Bi-Annual (Web Special): Save an amazing 52% and maximize your profits with our exclusive web offer.
Don’t miss this limited-time opportunity to access cutting-edge tools, real-time market analysis, and expert opinions.
Join InvestingPro today and unleash your investment potential. Hurry, the summer sale won’t last forever!
 Summer Sale Is Live Again!
Disclaimer: Please note that this article is purely informational and does not aim to promote or encourage the purchase of any assets. It is not a solicitation, offer, recommendation, advice, counseling, or suggestion to invest in any way. We would like to remind you that every asset carries a high level of risk and should be considered from various perspectives before making an investment decision. The responsibility of assessing the associated risks and making an investment decision lies solely with the investor.


