Master the Art of Fundamental Analysis With InvestingPro: Earnings Growth
2023.10.27 17:29
- Personal motivations often influence stock choices, but they don’t guarantee investment success.
- In the stock market, earnings growth and dividends play a crucial role in long-term performance.
- Use InvestingPro to gain insights into a stock’s financial health, with a focus on earnings and historical data for informed investment decisions.
Investors often have unique motivations behind their stock choices, and some examples include:
- “I buy Telecom Italia (BIT:) because I have been a customer of theirs for years and am comfortable with it.”
- “I buy Juventus Football Club SpA (BIT:) because it is my favorite team.”
- “I buy Saipem SpA (BIT:) because my third cousin’s husband works there, and he is doing well.”
While these reasons may seem valid on a personal level, they don’t provide insights into whether these are sound investment choices.
It’s important to realize that, in the medium to long term, as investors, the stock market is primarily driven by two significant factors:
- Earnings growth
- Dividends
Specifically, earnings contribute about 65-70% of the total, with dividends making up the remaining portion.
While various other analyses can be conducted, even seasoned investors like Peter Lynch have repeatedly emphasized that, in the grand scheme of things, consistent earnings growth is the most critical factor.
With this understanding in mind, let’s explore where and how we can access this crucial information, and this is where InvestingPro becomes valuable.
InvestingPro offers different sections that provide comprehensive insights for any company.
For example, you can select the financials tab and read up-to-date balance sheets and income statements for any company.
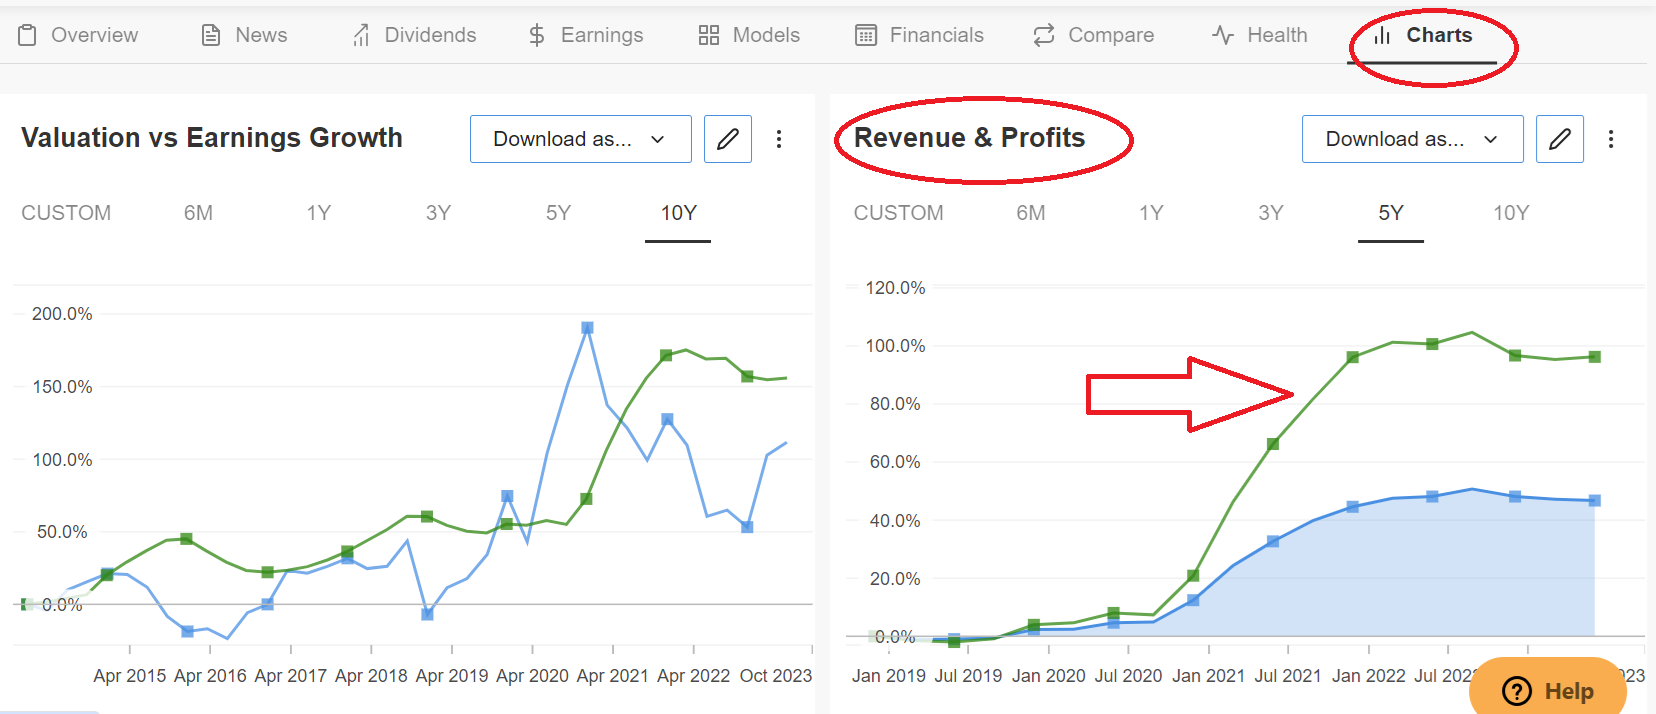
You can also go to the charts tab and see how the key financial metrics have trended over a certain time span.
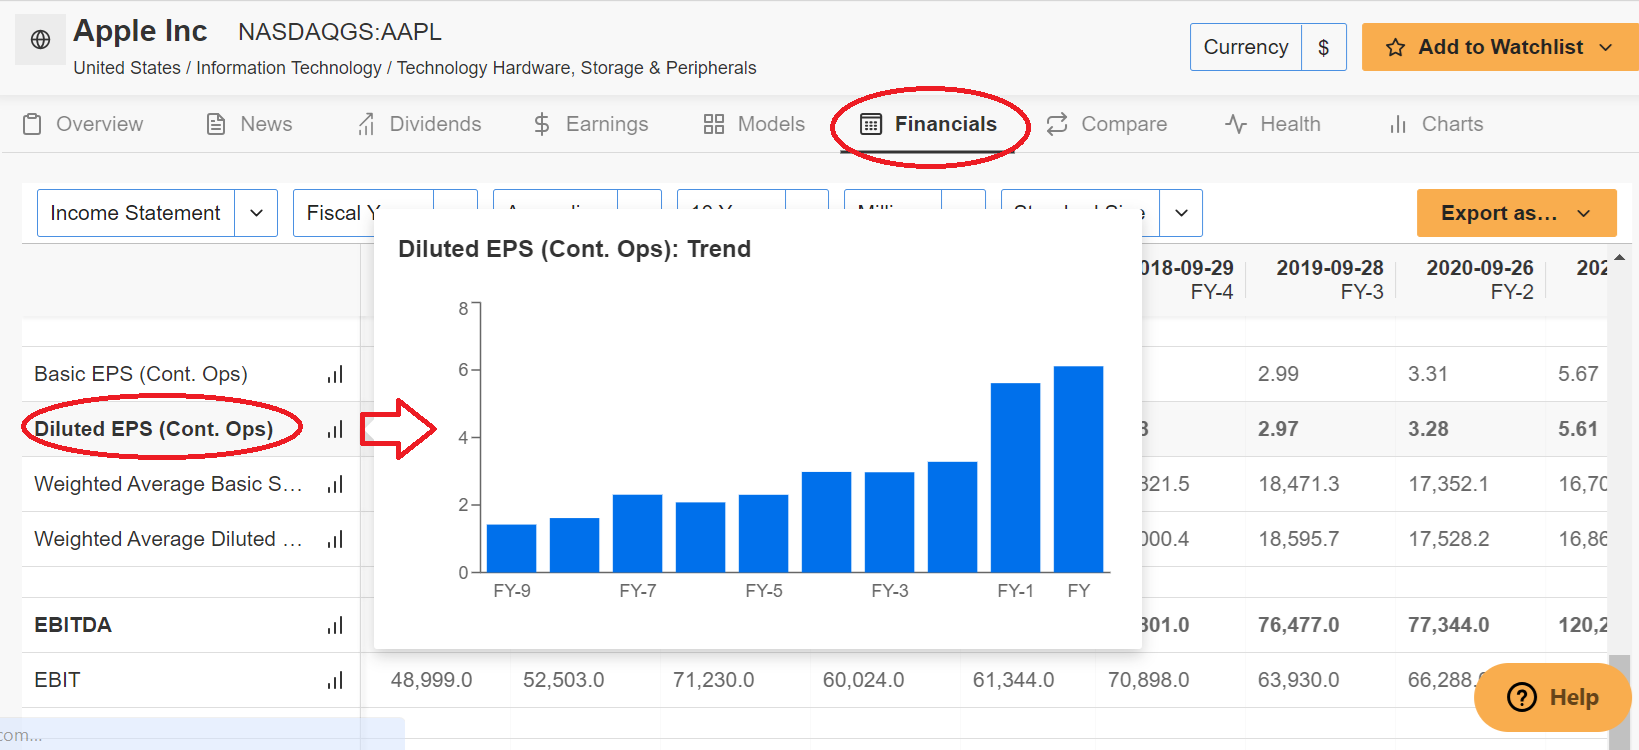
In the images below, we can see the balance sheet and income statement for Apple (NASDAQ:):
 Apple Financials on InvestingPro
 Apple – Charts Tab on InvestingProSource: InvestingPro
An analysis of the first image reveals an ideal earnings per share trend, characterized by consistent growth (as shown in Pic 1).
Conversely, in the context of the second image, it is evident that earnings frequently move in tandem with stock prices. However, when occasional situations arise, typically in the short term, where earnings show an upward trajectory while prices experience a decline — commonly referred to as divergence.
This scenario becomes particularly intriguing and warrants further investigation to uncover potential opportunities (as depicted in Pic 2).
What’s particularly advantageous in the full version of InvestingPro is that it offers a historical data range spanning up to 10 years, providing a wealth of information to observe statistically significant trends.
In our upcoming analysis, we’ll shift our focus to the second key driver of performance, namely dividends.
***
With InvestingPro, you can conveniently access a single-page view of complete and comprehensive information about different companies all in one place, eliminating the need to gather data from multiple sources and saving you time and effort.

Find All the Info You Need on InvestingPro!
Disclaimer: This article is written for informational purposes only; it does not constitute a solicitation, offer, advice, counseling or recommendation to invest as such it is not intended to incentivize the purchase of assets in any way. I would like to remind you that any type of assets, is evaluated from multiple points of view and is highly risky and therefore, any investment decision and the associated risk remains with the investor.


