Manhattan office market’s tough outlook persists, leaving investors on sidelines
2023.07.12 17:23

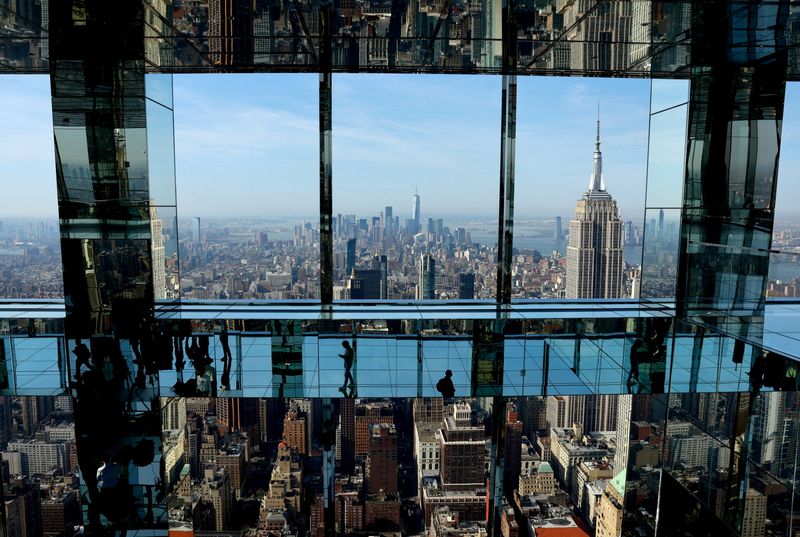
© Reuters. FILE PHOTO: The Empire State Building and Manhattan skyline are pictured from the Summit at One Vanderbilt observatory in Manhattan in New York City, U.S., April 14, 2023. REUTERS/Mike Segar/File Photo
2/2
By Herbert Lash
NEW YORK (Reuters) – The end of the pandemic has brought little relief to Manhattan’s depressed market for workspace, where empty floors remain the norm and by one calculation the values of 45% of the city’s office buildings are below their last sale price.
The amount of space leased in the second quarter was down almost 50% from a year ago and was a quarter less than the five-year pre-pandemic average, according to brokerage data provided to Reuters.
Even so, rental prices have held up and jumped for high-end space. But a slump in office building sales paints a more dire picture as capital remains reluctant to invest in a market radically changed by remote work.
“There’s essentially almost no market for office buildings right now because people don’t know where the bottom is,” said Andrew Nelson, a real estate economist who runs Nelson Economics in Washington.
Demand is strong for expensive space in trophy assets, but everything else is “getting more and more vacant,” he said. “It’s a slow-motion train wreck that’s going to take years to play out, but it’s bad now and it’s going to be getting worse.”
Unlike in past economic cycles, the office market has yet to correct after more than three years of a downturn, said Andrew Lim, a research director at Jones Lang LaSalle Inc in New York.
Opportunistic investors who could clear the market of unneeded office space and help lift values are biding their time, sitting on the sidelines, Lim said.
“We know there’s s a lot of capital around, whether it’s from domestic firms or sovereign wealth funds,” he said. But “buildings going back to the lenders or in foreclosure has not been as widespread as some of the more pessimistic pundits have predicted.”
The number of buildings in Manhattan with loan balances that exceeded their market value rose in the second quarter to 112, with 33.4 million square feet of space, from 73 with 15.1 million square feet of space the prior quarter, JLL said.
The difference in the current valuation of the 112 buildings from their last, mostly pre-pandemic sale price, totaled $38.3 billion, JLL said. That’s down from a valuation loss of $75.8 billion in the first quarter, the brokerage said.
The biggest construction boom in New York in decades, and building renovations that often cost $100 million or more, have kept office supply high and favored tenants looking to lease.
Year-to-date, negative net absorption – when an increase in supply along with more space being vacated is greater than the amount of space leased – is now 2.75 million square feet, brokerage CBRE Group Inc (NYSE:) said this week.
The increase in negative absorption comes despite the number of office jobs in Manhattan now exceeds pre-pandemic levels.
Leased square footage was down 46.7% from last year’s second quarter and was the lowest quarterly volume since the first quarter of 2021, JLL said in a report. And Savills Plc said direct available office space in Manhattan now measures 70.3 million square feet, the highest in history. “People talk about converting into residential, and that’s certainly possible for some, but it’s way overstated what the potential is,” said Nelson, throwing cold water on hopes large-scale conversion will right-size the market.
CONCESSIONS SOAR AT HIGH END
Landlords have increased concessions to bolster asking rents – a key metric in commercial real estate loans that lenders use to judge the revenue a property can generate – that have held steady during the pandemic.
“Asking rents overall really haven’t shifted since 2019, which is an anomaly given what past cycles have been like,” Lim said. “We know that is not perhaps the real state of the market.” Net effective rents, which include concessions such as allowances for tenants to improve an office, have doubled in price to $106 per square foot this year from $53 in 2020 for trophy buildings, Lim said.
But the net effective rent for office space in older Class B buildings barely rose during the pandemic, to $50 from $48, a sign of the market’s bifurcation between demand for the very best and the lack for lesser quality.
Mark Berry, managing director of REIT credit ratings at Kroll Bond Rating Agency LLC in New York, said capital sees an opportunity but it’s difficult to underwrite loans for office buildings as sales are so few it’s hard to judge true value.
“I don’t think values are yet at the point where those pools of capital are ready to put the money to work.”
(This story has been officially corrected to say ‘Savills Plc said direct available office space in Manhattan now measures 70.3 million square feet,’ not 70.4 million square feet, in paragraph 15)


