Lower-cost U.S. cities drove pandemic wage gains, ADP study shows
2022.07.14 17:10
4/4

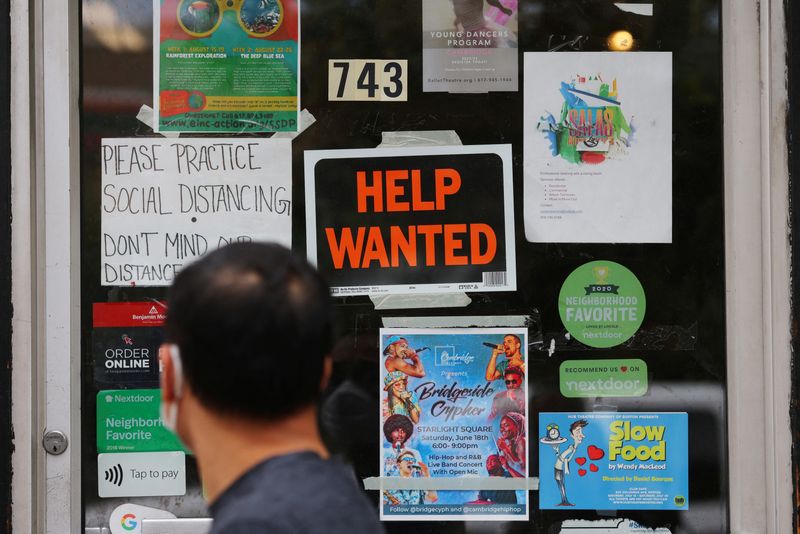
FILE PHOTO: A pedestrian passes a “Help Wanted” sign in the door of a hardware store in Cambridge, Massachusetts, U.S., July 8, 2022. REUTERS/Brian Snyder
2/4
By Howard Schneider
WASHINGTON (Reuters) – Big wage gains for lower-paid U.S. workers, a hallmark of the pandemic economy, were concentrated in less expensive cities, according to a new study that points to another potential stumbling block in getting the job market fully back to normal.
The study, released on Thursday by payroll processor ADP, analyzed wage gains in U.S. cities before and after the coronavirus pandemic for salaried workers in the bottom 5% of the wage distribution.
The strongest gains came in places where starting incomes were lower and, based on local home values, it was cheaper to live. The study’s authors suggest people found it easier to get by in those places by relying less on their own earnings from work, and more on income from a spouse or household member, retirement benefits, government support, or other means.
The result: Firms had to bid up wages faster to bring people in the door.
“The quick re-opening of the economy had employers scrambling to rehire,” but over time they “were left with a pool of candidates who had grown increasingly acclimated to living outside of the labor force,” Issi Romem of the ADP Research Institute and the ADP’s chief economist, Nela Richardson, wrote in the study.
“Getting by without working is more viable in low-income cities, all else being equal, because the cost of living and lost earnings tend to be lower … That could explain why employers in those cities increased wages more vigorously,” the authors wrote.
Topping the list was New Orleans, where monthly earnings for the lowest-paid 5% of workers jumped 42% from 2019 to 2021, compared to a 10.3% jump for lower-paid workers nationally and a 6.7% jump for all salaried workers. The study, which used ADP’s access to payroll information, looked at salaried workers so that changes in earnings implied a higher wage; hourly workers can earn more or less due to the amount of time worked.
While that is positive news from one standpoint, helping for example to ease income inequality, it may also point to larger issues ahead, Richardson said.
The study did not address the way recent price inflation may change work choices, but, all things being equal, it could mean that the country’s overall labor force participation rate will remain lower than before the pandemic if workers in some cities have simply found other ways to organize their lives.
Labor force participation reflects the share of the adult population that is working or looking for a job. It has been in steady decline in the United States since the turn of the century as the population ages and more people retire, but had begun climbing before the pandemic in an environment of rising wages and low unemployment.
U.S. officials hope it will return to the 63.4% level hit in February 2020, just before the outset of the pandemic, but in recent months the rate has stalled at around 62.2%.
INCOME DIVIDE
The ADP study pointed to another issue as well. At the upper end of the spectrum, the largest increases among the top 5% of earners occurred in the coastal cities where incomes were already the highest, a fact that may widen the divide between those already-expensive places and the rest of the country.
“While the cost-benefit calculus of expensive city living ostensibly remains favorable for the college-educated, rising home prices have made it increasingly unfavorable for people without a degree,” the study concluded, with U.S. migration patterns during the pandemic beginning to show the effect.
“Population sorting has concentrated degree-holders and their high salaries in the nation’s expensive metros, resulting in increased economic – and likely political and cultural – polarization.”


