Last AAA-Rated Stocks in the S&P 500 Look Poised for Long-Term Outperformance
2023.08.10 05:15
- Last week, Fitch downgraded the U.S. debt rating from AAA to AA+.
- After the recent US debt downgrade, we decided to take a look at a few stocks that have the highest possible rating.
- Surprisingly, among the top names, only two stocks have managed to maintain the perfect score.
Last week, Fitch downgraded the U.S. debt rating to AA+, which is one notch below the highest rating. This came after Fitch had placed the rating on negative watch back in May due to concerns surrounding the debt ceiling.
Fitch’s decision to downgrade was driven by two key factors: the projected fiscal decline over the next three years and the escalating debt burden of the U.S. government.
This situation isn’t entirely new. Back in April 2011, a similar event occurred when Standard & Poor’s, another rating agency, downgraded the country’s credit rating from AAA to AA+.
These actions have faced criticism, including remarks from U.S. Treasury Secretary Janet Yellen, who argued that the decisions were based on outdated data. She defended the country’s economic policies and the budget’s potential to reduce the deficit by more than $2 trillion.
Established in 1914, Fitch is one of the significant rating agencies alongside Moody’s and S&P Global. These agencies employ an alphabetical scale to assess countries’ and companies’ ability to meet their obligations, essentially their solvency to repay their debts.
Long-term grades are assigned on a scale from ‘AAA’ (highest) to ‘D’ (lowest). Intermediate ratings between ‘AAA’ and ‘CCC’ are indicated using +/- signs.
The graph below illustrates these grades and offers a comparison among the three rating agencies. On the right side are the short-term ratings, and on the right-hand side are the long-term ones.

Rating Agencies Comparison
Despite the cuts, two companies within the still hold the highest AAA rating, namely Johnson & Johnson (NYSE:) and Microsoft (NASDAQ:).
Others, like Alphabet (NASDAQ:) (AA+), Apple (NASDAQ:) (AA), Amazon (NASDAQ:) (AA), Berkshire Hathaway (NYSE:) (AA), and Walmart Inc (NYSE:) (AA), are rated just one level below the highest possible rating score.
Let’s take a deeper look into these companies’ financial to assess whether the perfect rating implies competitive advantages against their peers.
Johnson & Johnson
Founded in 1886 in the United States, Johnson & Johnson is a well-known company dealing in medical devices, pharmaceuticals, personal care, and baby products. The company’s headquarters are located in New Jersey.
On July 20, Johnson & Johnson released that were above market expectations in terms of both revenue and earnings per share. During the second quarter, it recorded a net profit of $5.144 billion, showing a significant increase of +6.9% compared to the same period in 2022.
Looking ahead, the New Jersey-based company is gearing up to unveil its next results on October 17. The projections indicate that adjusted earnings per share are likely to rise by around +5%, reaching $10.75 in 2023. This upward trend is expected to continue as earnings are forecasted to grow each year from 2023 to 2027.
When it comes to dividends, mark your calendars for September 7, as the company plans to distribute $1.19. To be eligible for this, you’ll need to hold shares before August 25. With an annual dividend yield of +2.75% and a payout ratio of 91.60%, Johnson & Johnson’s commitment to providing returns to shareholders is noteworthy.
Despite facing a barrage of lawsuits related to alleged carcinogenic substances in its baby powder, the company remains resilient. In fact, the company’s stock has experienced an upswing.
The stock has surged 8.52% over the past month, 7.45% over the last three months, and +4.60% over the past year. Its impressive performance extends over longer timeframes as well, with a remarkable 51.24% growth over the last five years and an impressive 160.80% surge over the past decade.
According to InvestingPro’s models, Johnson & Johnson shows promising potential, with a projected valuation of $195, signaling a positive outlook moving forward.
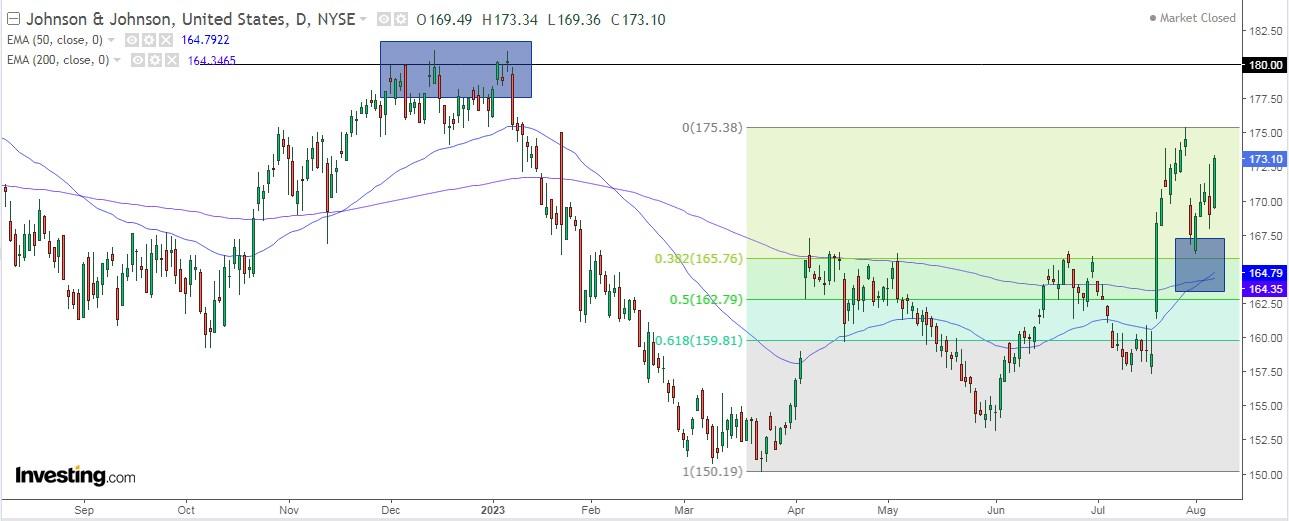
 Johnson & Johnson Stock Daily ChartThe recent downward movement in its shares halted just around the initial Fibonacci level. Notably, this level closely aligns with both the 50-day moving average and the 200-day moving average, reinforcing that particular zone.
2. Microsoft
Microsoft’s on July 25 not only surpassed market expectations but also demonstrated robust performance in terms of revenue and earnings per share.
Microsoft recorded a net profit of $20.1 billion, indicating an impressive 20% increase compared to the previous year. Revenues amounted to $56.2 billion, reflecting a remarkable 8% surge over the revenue from the corresponding period in 2022.
The next earnings are due on October 25.
Regarding dividends, a payout of $0.68 is set for September 14. To be eligible for this, ensure your shares are held before August 16. Microsoft proudly boasts an annual dividend yield of +0.82%.
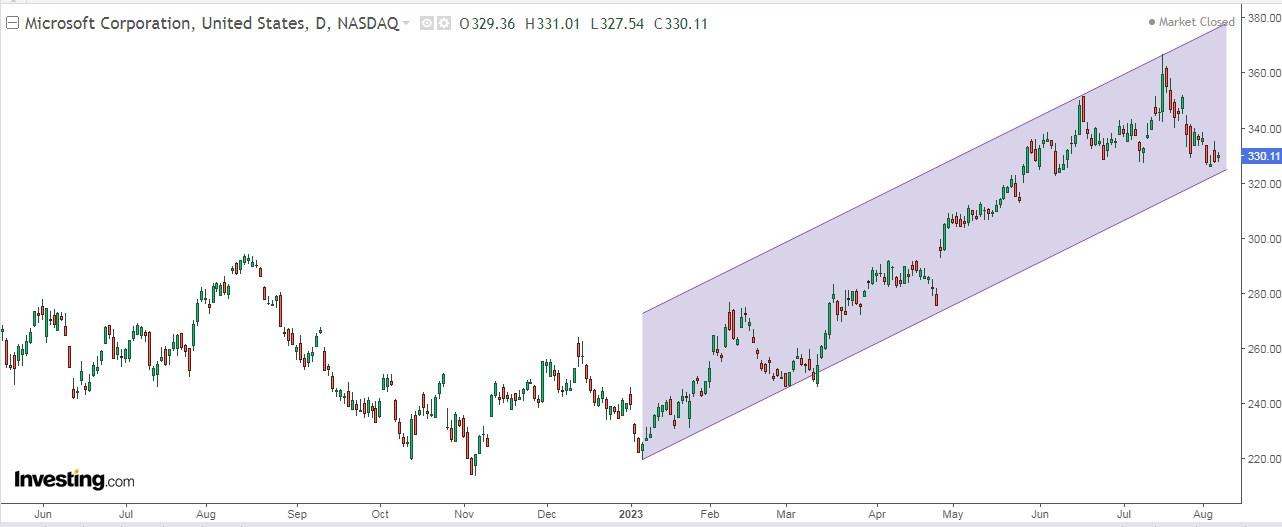
 Over the past three months, its shares have surged by an impressive +7.19%. Looking back over the last year, the upward momentum continued, resulting in a remarkable +18.90% gain.
The company’s stock performance over the last five years has been even more remarkable, boasting a substantial +220.22% increase. However, the most striking growth has occurred over the past decade, with an astonishing surge of +1,077.50%.
Market analysts have given the stock a target of $390.65.
***
Find All the Info you Need on InvestingPro!
Disclaimer: This article is written for informational purposes only; it is not intended to encourage the purchase of assets in any way, nor does it constitute a solicitation, offer, recommendation, advice, counseling, or recommendation to invest. We remind you that all assets are considered from different perspectives and are extremely risky, so the investment decision and the associated risk are the investor’s own.


