JPMorgan, Citigroup, Wells Fargo to Kick Off Earnings Season: What to Expect?
2023.07.13 09:29
- Q2 earnings season kicks off with the banking sector entering the limelight
- Banking crisis concerns have abated following stress tests by the Fed
- Big players Citigroup, JPMorgan, and Wells Fargo report first with positive expectations
Q2 earnings season kicks into high gear tomorrow with prominent players in the banking industry, including Citigroup (NYSE:), JPMorgan Chase (NYSE:), and Wells Fargo (NYSE:) providing further clues about the health of the U.S. financial sector.
After a difficult H1, primarily stemming from concerns over a widespread banking crisis following the Silicon Valley Bank collapse, the sector’s overall outlook now appears more optimistic, with profit forecasts anticipating a healthy year-on-year growth of +3.8%, complemented by a robust +11.9% increase in revenue. That’s largely thanks to the timely intervention of the Federal Reserve and its injection of approximately $400 billion in additional liquidity.
Furthermore, big banks comfortably passed the Fed’s stress test, which evaluated their balance sheets by subjecting them to a hypothetical severe economic downturn that varies in its elements from year to year.
But despite the seemingly positive scenario, is it time to go ahead and buy bank shares? Let’s take a closer look at each one of the three banks reporting earnings tomorrow to assess the current situation in depth.
Citigroup EPS to Decline Further?
Citigroup, despite passing the stress tests, will be required to increase its Stress Capital Buffer from 4% to 4.3%. This decision hasn’t been received enthusiastically, and CEO Jane Fraser has mentioned that there will be a dialogue with the Federal Reserve regarding this matter.
Looking at the expected earnings per share (EPS) forecasts for Citigroup, there has been a notable decline in the past month. The estimates have dropped from $1.66 to $1.41, with 8 downward revisions and 3 upward revisions.

Citigroup Upcoming Earnings Report
Source: InvestingPro
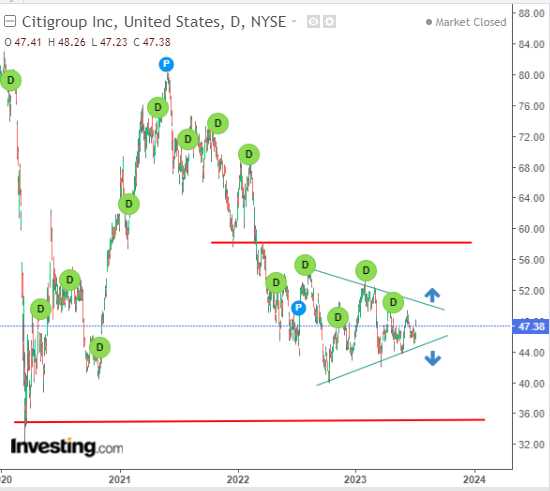
The stock’s technical situation is quite intriguing, as it is currently undergoing a consolidation phase that is forming a triangle pattern.

Citigroup Daily Chart
Friday’s report could serve as a catalyst for a potential breakout, depending on how the results compare to the current forecasts. Considering the fair value estimate at $58-$59, a bullish scenario appears to be more probable.
If the earnings surpass expectations or indicate positive growth, it could provide the impetus for the stock to move higher and potentially break out from its current consolidation phase.
Strong Analyst Optimism Ahead of JPMorgan Earnings
JPMorgan Chase is in a more favorable position in terms of predictions leading up to the Q2 results compared to Citigroup. In recent weeks, there has been a trend of upward revisions dominating the forecasts following the April .
This indicates an increasing positive sentiment and improved expectations for JPMorgan Chase’s performance. Currently, the market is anticipating earnings per share of $3.80 and revenue of $38.849 billion.

JPMorgan Upcoming Earnings Report
Source: InvestingPro
Looking at the trend of recent quarters’ results, there has been a positive trajectory in both earnings per share and revenue, with a surprising upward trend. Moreover, we have consistently observed positive market reactions over the past year, which suggests that a similar response is likely to occur this time if the upcoming results exceed the forecasts.
 JPMorgan Stock Reaction After Earnings
Source: InvestingPro
Wells Fargo Set to Test Year’s Highs?
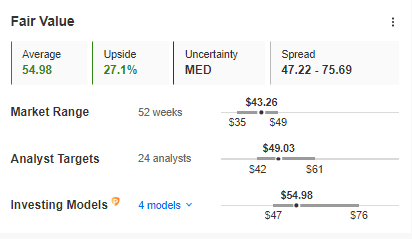
Among the three analyzed stocks, Wells Fargo currently exhibits the highest potential for upward movement, with a fair value upside of 27.1%. This indicates that there is significant room for the stock’s value to increase based on the fair value estimate.

Wells Fargo Fair Value
Source: InvestingPro
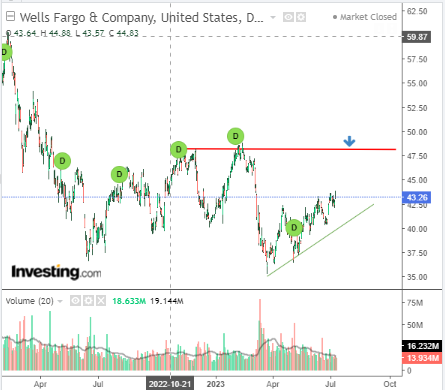
If these forecasts come to fruition, it would likely result in a breakout to new highs for the year. However, before reaching those highs, the bulls may face challenges near the resistance level situated within the price range of $48-$49.

Wells Fargo Daily Chart
The bearish scenario would materialize if there is a breakout below the local upward trend line and the stock price falls below $40 per share. This could indicate a shift in market sentiment and a potential reversal of the upward trend.
Naturally, tomorrow’s will play a crucial role in determining the sustainability of the current upward trend. The market forecasts are at $1.14 earnings per share and $20.068 billion in revenue.
***
Access first-hand market data, factors affecting stocks, and comprehensive analysis. Take advantage of this opportunity by subscribing and unlocking the potential of InvestingPro to enhance your investment decisions.
And now, you can purchase the subscription at a fraction of the regular price. Our exclusive summer discount sale has been extended!
InvestingPro is back on sale!
Enjoy incredible discounts on our subscription plans:
- Monthly: Save 20% and get the flexibility of a month-to-month subscription.
- Annual: Save an amazing 50% and secure your financial future with a full year of InvestingPro at an unbeatable price.
- Bi-Annual (Web Special): Save an amazing 52% and maximize your profits with our exclusive web offer.
Don’t miss this limited-time opportunity to access cutting-edge tools, real-time market analysis, and expert opinions.
Join InvestingPro today and unleash your investment potential. Hurry, the Summer Sale won’t last forever!
 Summer Sale Is Live Again!
Disclaimer: This article is written for informational purposes only; it is not intended to encourage the purchase of assets in any way, nor does it constitute a solicitation, offer, recommendation, advice, counseling, or recommendation to invest. We remind you that all assets are considered from different perspectives and are extremely risky, so the investment decision and the associated risk are the investor’s own.


