Italy industry output posts surprise jump in August
2022.10.11 04:48
[ad_1]

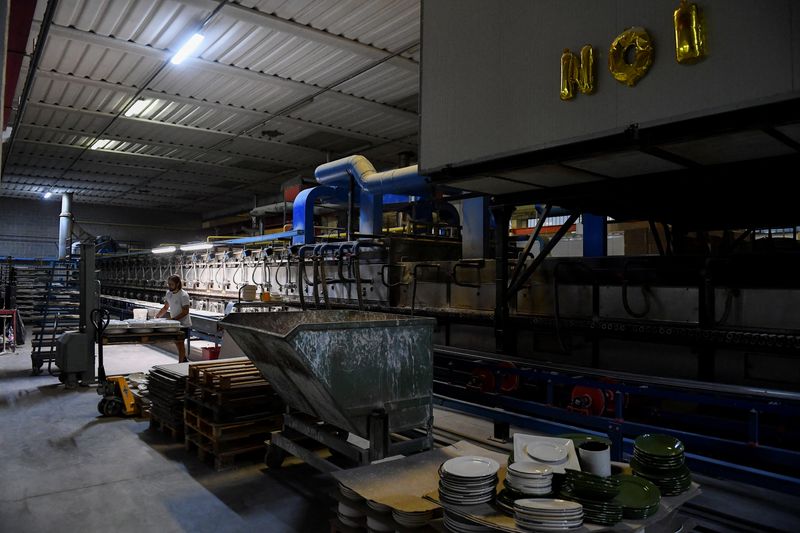
© Reuters. FILE PHOTO: An employee works at a ceramics factory where the workers start their shifts before dawn to optimise sunlight and save energy, in Citta di Castello, Italy, August 30, 2022. REUTERS/Jennifer Lorenzini
ROME, Oct 11 (Reuters) – Italian seasonally and workday-adjusted industrial output was much stronger than expected in August, jumping 2.3% from the month before, but the three month rolling average remained negative, data showed on Tuesday.
A Reuters survey of 20 analysts had pointed to a 0.2% uptick in August.
National statistics bureau ISTAT marginally revised up July’s data to show a 0.5% rise, originally reported as 0.4%.
Italian industrial output can be highly volatile in August, when many factories are closed and seasonal and calendar adjustments are more difficult.
Despite August’s jump, in the June-to-August period industrial output was still down 1.2% compared with the three months to May, ISTAT said.
On a work-day adjusted year-on-year basis, industrial output in the euro zone’s third largest economy was up 2.9% in August, ISTAT said, following a 1.3% decline in July.
August saw month-on-month increases in output of consumer goods, investment goods and intermediate goods, while energy products declined.
The Italian economy grew by a strong 1.1% in the second quarter from the previous three months, but more recent data has pointed to a sharp slowdown as firms and families struggle with high inflation and surging energy costs.
Last month the Treasury forecast that gross domestic product probably contracted in the third quarter and will continue to decline in the fourth quarter and in the first quarter of next year.
ISTAT gave the following details.
INDUSTRIAL PRODUCTION AUG JULY JUNE
Mth/mth pct change (adjusted) 2.3 0.5r -2.0
Yr/yr pct change (adjusted) 2.9 -1.3r -1.1
Yr/yr pct change (unadjusted) 2.8 -4.3 -1.1
NOTE: BASE 2015=100.
r = revised figures
ISTAT provided the following breakdown by broad product group in August: adjusted month-on-month percent change.
Consumer goods 2.6
Investment goods 1.8
Intermediate goods 0.8
Energy goods -2.3
((Gavin Jones, gavin.jones@thomsonreuters.com))
[ad_2]
Source link


