How US stocks rose 20% from their lows, and where they might be going
2023.06.09 01:57

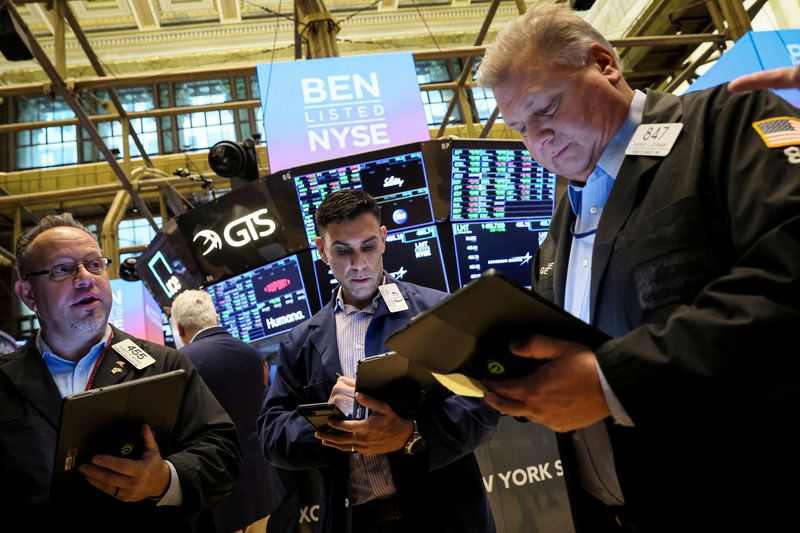
© Reuters. FILE PHOTO: Traders work on the floor of the New York Stock Exchange (NYSE) in New York City, U.S., November 15, 2022. REUTERS/Brendan McDermid
By Saqib Iqbal Ahmed
NEW YORK (Reuters) – U.S. stocks have defied fears of a recession, a banking crisis and soaring Treasury yields to rise 20% from their October lows – one definition of a bull market.
The benchmark closed at a low of 3,577.03 on Oct. 12, 2022, down 25% from its all-time high after the Federal Reserve unleashed a series of bruising interest rate increases to fight decades-high inflation.
On Thursday, it closed up 0.6% at 4,293.93, amid growing optimism over the economic outlook and a rate hiking cycle that appears to be nearing its end. Here are some features of the index’s rally, and a look at where stocks might go from here.
GRAPHIC: Bear market highlights –
While markets seldom rise in a straight line, the S&P 500’s journey from the bottom took 164 days – the longest 20% climb from a bear market low in five decades. Among the factors holding stocks back was a surge in Treasury yields to their highest levels in decades that dulled the allure of equities by offering investors the potential to earn attractive income in government-backed bonds.
A crisis that saw the biggest bank busts since the Great Recession also shook investor confidence, as did worries over a potentially catastrophic fight over lifting the U.S. debt ceiling.
GRAPHIC: Taking its time –
The narrow breadth of the S&P 500’s rally has been a concern for some investors, with just seven stocks – Alphabet (NASDAQ:), Apple (NASDAQ:), Microsoft (NASDAQ:), Amazon (NASDAQ:), Meta, Nvidia (NASDAQ:) and Tesla (NASDAQ:) – responsible for almost all of the index’s gains this year. Many investors view these stocks as safe bets in uncertain times. Their gains were also driven by excitement over advances in artificial intelligence.
GRAPHIC: S&P 500 gets a lift from heavyweights –
More recently, however, the market’s gains have shown tentative signs of broadening out to other stocks.
GRAPHIC: Breadth –
Meanwhile, volatility has subsided – not only in stocks, but in Treasuries and currencies.
GRAPHIC: Volatility vaporized –
One reason for the calm in markets is investors’ belief that the Fed is unlikely to deliver many more of the rate hikes that shook asset prices last year.
Investors have also been encouraged by evidence showing that the U.S. economy continues to be resilient in the face of the central bank’s monetary tightening, while inflation slowly cools. The U.S. Citigroup (NYSE:) Economic Surprise Index shows U.S. economic data has in aggregate topped market expectations, helped by stronger than expected numbers for employment and consumer spending.
GRAPHIC: U.S. outperformance –
A 20% gain from bear market lows has in the past heralded further upside for stocks.
In four of the last six bear markets, the S&P went on to rise 20% or more in the six months after hitting this milestone.
GRAPHIC: What now? –


