How to Outperform the S&P 500 With the ‘Best of Buffett’ Strategy
2023.12.12 13:19
- ProPicks by InvestingPro is an AI-driven tool using 50+ indicators for fundamental analysis.
- In this piece, we will learn about ProPicks’ decision-making, which uses a blend of AI and human analysis to uncover stock picks.
- We will also decode ProPicks’ data interpretation, focusing on metrics and portfolios like ‘Buffett’s Best Stocks.’
ProPicks, a tool provided by InvestingPro, serves as a valuable resource for investors, primarily focusing on supporting fundamental analysis in its broadest context. The core function of ProPicks is to offer pre-designed investment strategies, utilizing various benchmarks as reference points to gauge the historical performance of specific investment portfolios.
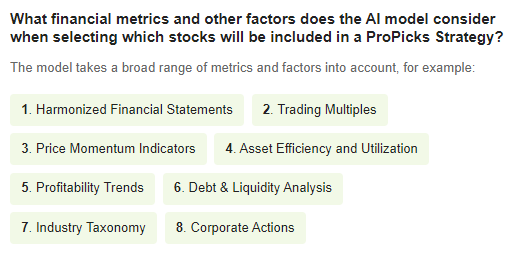
Each investment strategy is mainly created based on the AI model, which analyzes historical data and, based on a rich set of information, classifies them on a scale of inferior, neutral, and better than the benchmark. The AI model takes into account more than 50 financial indicators over 25 years. Here are the top indicators considered:

Financial Metrics Considered by AI
Source: InvestingPro
The final decision, however, is determined by the analyst, who chooses which stocks to include in the portfolio based on the results provided by the model.
ProPicks Decision-Making Process Explained
Analysis of the dataset and its classification is the first step in the decision-making process performed by the ProPicks tool. The next step is data processing in the form of applying machine learning techniques, manual quality control, and training the model using Google’s Vertex AI platform.
This is crucial in such a dynamic environment as the financial markets, where new data is constantly being delivered, which the AI model must be able to classify correctly. The final step is to assign the rigorously selected stocks to one of the six available strategies and perform a historical analysis based on the proprietary backtesting model.
However, it should be emphasized that the human factor is equally important here, as it is the analyst who performs the decisive suitability assessment and is responsible for the assignment of a particular strategy. It is also important to realize that the portfolio’s performance relates to back-testing and is not a guarantee of obtaining the same results in the future.
How to Interpret the Data Presented by the Propicks Strategy?
Once the analytical process is done, the tool presents specific data depending on which strategy you want to be inspired by or implement in its entirety. We have a range of information at our disposal, from which 5 basic metrics have been selected:
- Total return – Percentage return derived from backtesting over the past 10 years
- Performance vs. S&P 500 – Difference between the strategy’s return and that of the benchmark
- Annual return – Percentage gain per year.
- Sharpe ratio – Comparison of the return to the risk taken, the higher the ratio, the better
- Risk rating – An overall assessment of the risk associated with executing a given strategy
The other items already relate in detail to specific stocks that are or were in the portfolio during the period.
ProPicks Strategy: ‘Buffett’s Best Stocks’
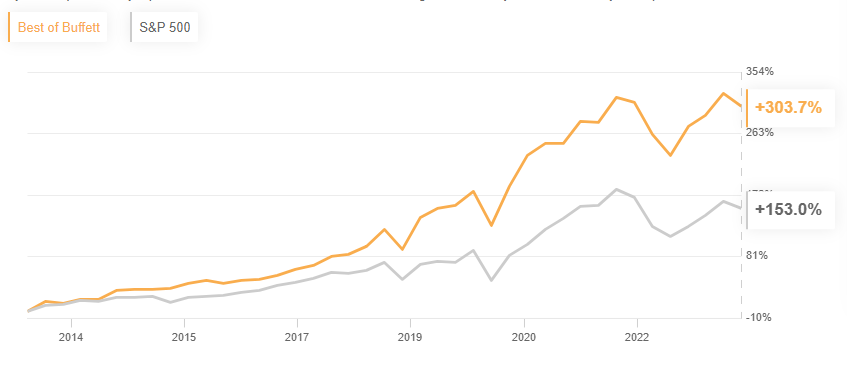
One of the available portfolios is “Buffett’s Best Stocks,” which reflects the set of stocks found in Berkshire Hathaway’s (NYSE:) (NYSE:) portfolio and is updated quarterly with the publication of the mandatory f13 report. Back-test results indicate a +150% outperformance of the benchmark over recent years.
 Best of Buffett Vs. S&P 500
Source: InvestingPro
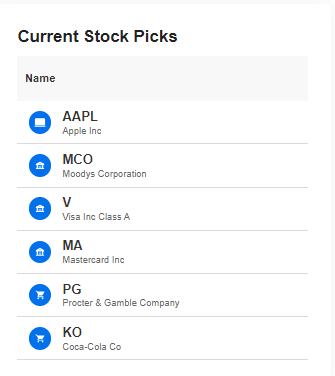
The details of the strategy also show what is most relevant to the practical application of the methodology, i.e. the recommended stocks in a given data collection period.

Current Stock Picks
Source: InvestingPro
The tool also allows you to see what stocks were held in a given quarter in the past with detailed fundamental data presented.
***
You can easily determine whether a company is suitable for your risk profile by conducting a detailed fundamental analysis on InvestingPro according to your criteria. This way, you will get highly professional help in shaping your portfolio.
You can sign up for InvestingPro, one of the most comprehensive platforms in the market for portfolio management and fundamental analysis by clicking on the banner below.

Claim Your Discount Today!
Disclaimer: This article is written for informational purposes only; it does not constitute a solicitation, offer, advice, or recommendation to invest as such it is not intended to incentivize the purchase of assets in any way. I would like to remind you that any type of asset, is evaluated from multiple points of view and is highly risky and therefore, any investment decision and the associated risk remains with the investor.


